Figure 5.

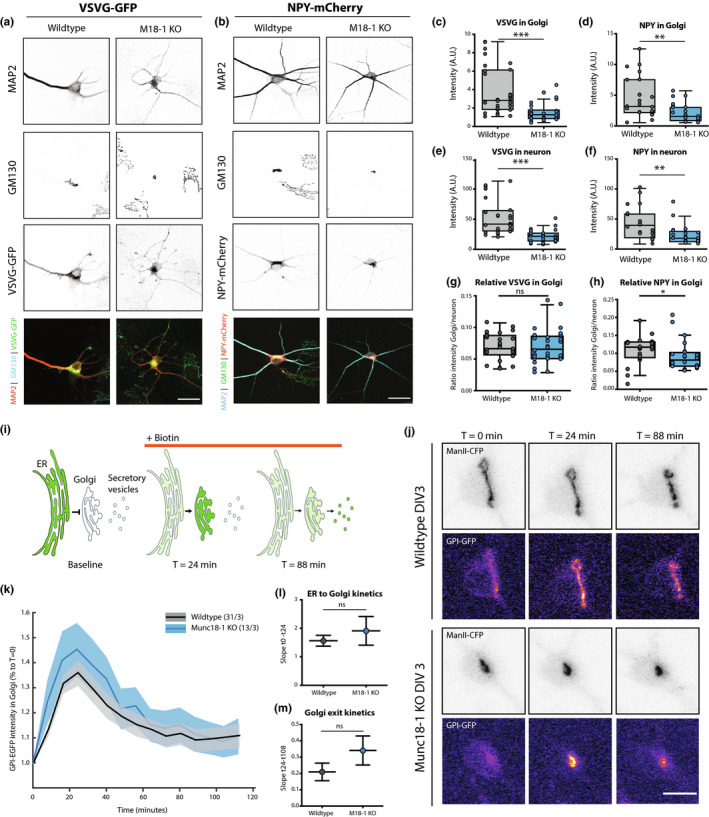
Anterograde transport through the Golgi is unaffected in Munc18‐1 KO neurons. (a) Typical example of WT and Munc18‐1 KO neurons over‐expressing VSVG‐GFP at DIV3, stained for MAP2 (dendritic marker), cis‐Golgi (GM130) and GFP. Scale bar is 25μm. (b) Typical example of WT and Munc18‐1 KO neurons over‐expressing NPY‐mCherry at DIV 3, stained for MAP2 (dendritic marker), cis‐Golgi (GM130) and mCherry. Scale bar is 25μm. (c) VSVG‐GFP intensity in the Golgi of Munc18‐1 KO neurons was ~60% lower (p < .0001, Mann–Whitney test). N: WT = 28/3, KO = 28/3. (d) Munc18‐1 KO neurons showed a ~55% reduction in NPY‐mCherry intensity in the Golgi area (p = .001, Mann–Whitney test). N: WT = 23/3, KO = 24/3. (e) VSVG‐GFP intensity in neuron was ~60% lower in Munc18‐1 KO neurons (p < .0001, Mann–Whitney test). N: WT = 28/3, KO = 28/3. (f) NPY‐mCherry intensity in Munc18‐1 KO neurons was ~45% lower (p = .0024, Mann–Whitney test). N: WT = 23/3, KO = 24/3. (g) Relative VSVG‐GFP distribution in the Golgi, measured by VSVG‐GFP intensity in Golgi (c) divided by total VSVG‐GFP intensity (E), was not different in Munc18‐1 KO neurons (ns p = .58, Mann–Whitney test). N: WT = 28/3, KO = 28/3. (h) Relative NPY‐mCherry distribution in the Golgi, measured by NPY‐mCherry intensity in Golgi (d) divided by total NPY‐mCherry intensity (f), was 15% lower in Munc18‐1 KO neurons (ns p = .026, Mann–Whitney test). N: WT = 23/3, KO = 24/3. Data is represented in Tukey boxplots. Columns and dots represent individual litters and neurons, respectively. (i) Cartoon representing RUSH assay. Under baseline conditions, GPI‐GFP‐SBP is bound to KDEL‐streptavidin and therefore retained in the ER. Upon biotin administration, the binding between SBP and streptavidin is reversed, thereby releasing the GPI‐GFP cargo into the secretory pathway. (j) Representative images of WT and Munc18‐1 KO DIV3 neurons expressing Golgi marker ManII‐CFP and GPI‐GFP. Biotin was added at T = 0. Scalebar is 10μm. (k) GPI‐GFP intensity in the Golgi of WT and Munc18‐1 KO neurons over time after biotin administration. Shown are mean and SEM. N: WT = 31/3, KO = 13/3. (l) GPI transport to the Golgi, measured as the fitted slope between t = 0 and the highest intensity, t = 24min, was not significantly different between WT and Munc18‐1 KO neurons (p = .42, F = 0.633, DFn = 1, DFd = 172, linear regression). N: WT = 31/3, KO = 13/3. (m) No differences were observed in Golgi exit, measured as the fitted slope between t = 24 and t = 112, between the two conditions (p = .19, F = 1.656, DFn = 1, DFd = 480, linear regression). N: WT = 31/3, KO = 13/3. N = number of neurons/number of independent cell cultures
