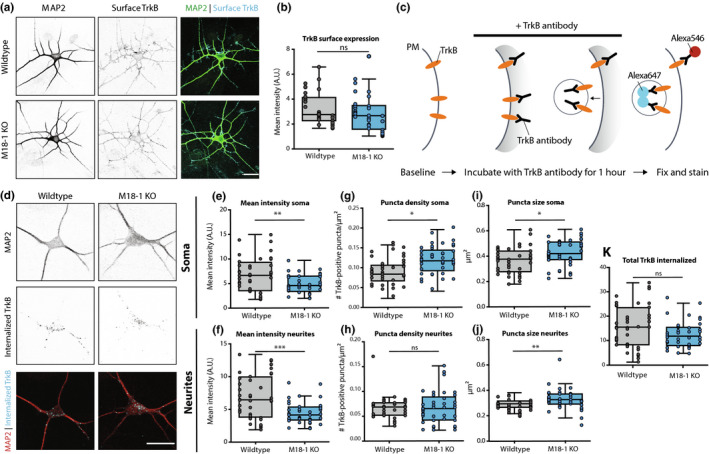
Figure 7.

Retrograde TrkB transport is affected in Munc18‐1 KO neurons. (a) Typical example of WT and Munc18‐1 KO neurons at DIV3 stained for MAP2 (dendritic marker) and surface TrkB. Scale bar is 25 μm. (b) Average TrkB surface levels were not affected in Munc18‐1 KO neurons (ns p = .23, Mann–Whitney test). N: WT = 35/3. KO = 30/3. (c) Cartoon representing TrkB antibody uptake assay. Neurons were incubated with TrkB antibody for one hour, before they were fixed and stained. Remaining surface TrkB was stained with Alexa546, whereas internalized TrkB was stained with Alexa647. (d) Typical examples of WT and Munc18‐1 KO neurons fixed after the TrkB antibody uptake assay and stained for MAP2 (dendritic marker) and internalized TrkB (Alexa647). (e) Mean TrkB puncta intensity in the soma of Munc18‐1 KO neurons was ~30% lower (p = .003, unpaired T test). N: WT = 41/4. KO = 41/4. (f) Mean TrkB puncta intensity in neurites was ~35% lower in Munc18‐1 KO neurons (p = .0007, Mann–Whitney test). N: WT = 41/4. KO = 41/4. (g)Munc18‐1 KO neurons showed an ~20% increase in TrkB puncta density in the soma (p = .01, Mann–Whitney test). N: WT = 41/4. KO = 41/4. (h) TrkB puncta density was not different in neurites of Munc18‐1 KO neurons (ns p = .12, Mann–Whitney test). N: WT = 41/4. KO = 41/4. (i) Average TrkB puncta size in the soma of Munc18‐1 KO neurons was ~15% bigger (p = .01, unpaired T test). N: WT = 41/4. KO = 41/4. (j) In neurites of Munc18‐1 KO neurons, average TrkB puncta size was ~10% bigger (p = .12, Mann–Whitney test). N: WT = 41/4. KO = 41/4. (k) Total pool of internalized TrkB was not different between WT and Munc18‐1 KO neurons (p = .07, unpaired T test). N: WT = 41/4. KO = 41/4. Data are represented in Tukey boxplots. Columns and dots represent individual litters and neurons, respectively. N = number of neurons/number of independent cell cultures
