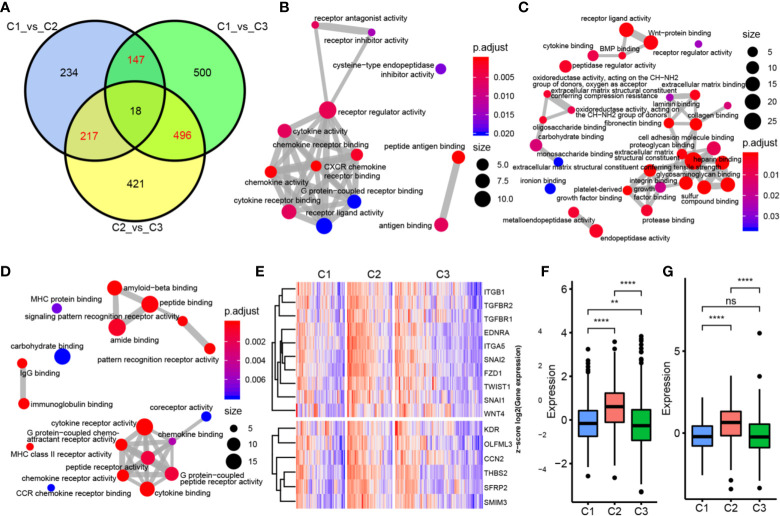
Figure 4.
Functional analysis of immune gene module. (A) Wayne map of the difference genes in three subtypes. (B) GO pathway enriched by C1 subtype specific genes. (C) GO pathway enriched by C2 subtype specific genes. (D) GO pathway enriched by C3 subtype specific genes. The thickness of the line indicates the number of shared genes; the color indicates FDR, and the node size indicates the number of enriched genes. (E) The upper panel represents the expression profile clustering heat map of EMT marker genes, and the lower panel represents the expression profile clustering heat map of ESC marker genes. (F) Box plot of expression and distribution of EMT marker gene in three subtypes. (G) The expression distribution of ESC marker gene in three subtypes was different by box line diagram. **P < 0.01, ****P < 0.0001, and ns, ‘No Significant’.

