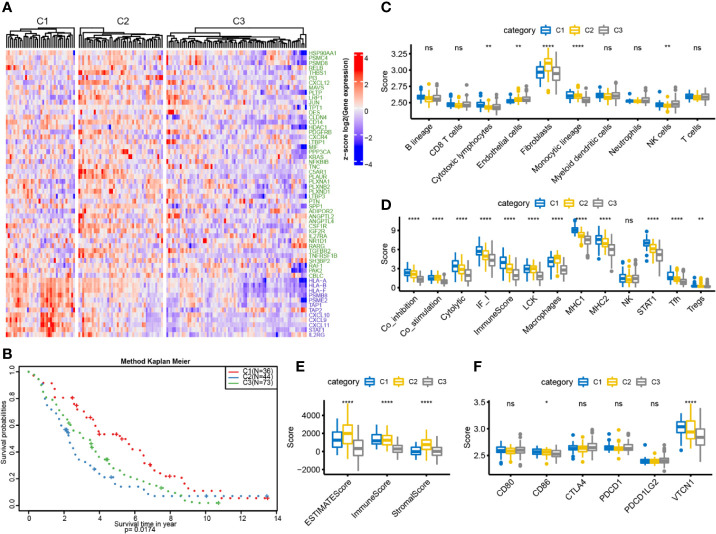
Figure 6.
OC immunotyping based on IRGs in validation set. (A) Gene expression heatmap of OC immune subtypes. (B) The K-M curve of the overall survival rate of the immune subtypes in the validation dataset, measured by log rank test. (C) 10 immune components difference in each subtype. (D) The differences of 13 kinds of immune components in different subtypes. (E) The box plot of immune score difference in each subtype was calculated by ESTIMATE. (F) The expression differences of 6 common immune checkpoint genes among three subtypes. *P < 0.05, **P < 0.01, ****P < 0.0001, and ns ‘No Significant’.

