Figure 7.
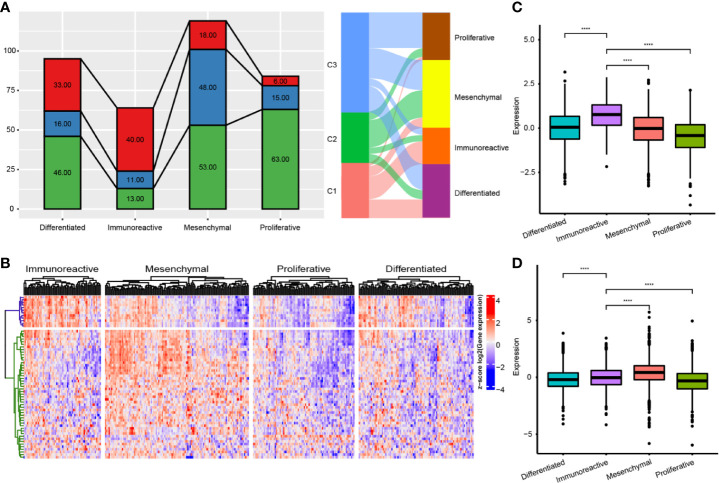
Comparison of immune subtypes and existing subtypes. (A) The intersection of molecular subtypes and immune subtypes in TCGA. (B) Clustering heatmap of prognosis related immune genes in four subtypes. (C) Differential distribution of G1 gene set expression among immune subtypes. (D) Differential distribution of G1 gene set expression among immune subtypes. ****P < 0.0001.

