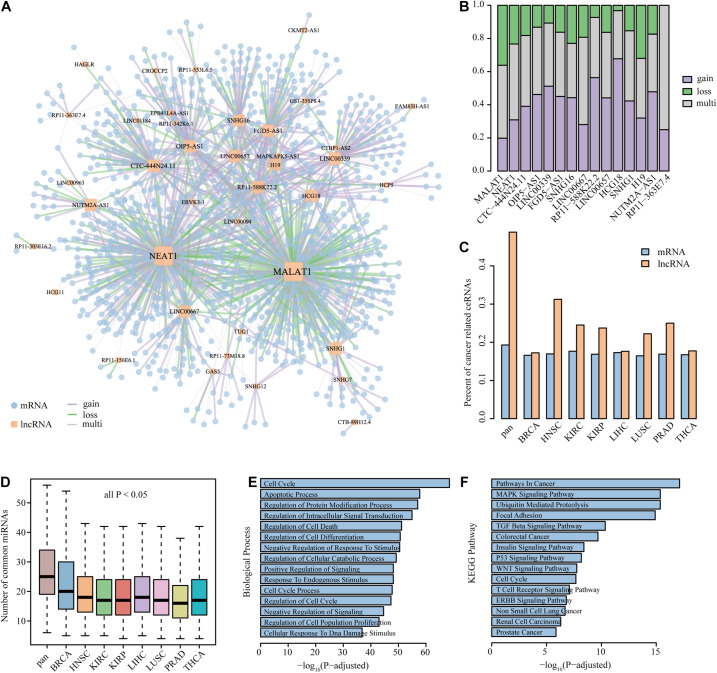
FIGURE 4.
The property and functional analysis of the core component. (A) The largest component of the core dysregulated ceRNA interactions. (B) The property of edge linked to lncRNAs in the core component. The assignment of lncRNAs was sorted by node degree in the core component. Only show the lncRNAs with a degree of more than 10 in the core component. (C,D) The comparison of the percent of cancer-related ceRNAs and the number of common miRNAs between the core component ceRNAs and single dysregulated network. (E,F) The biological process and KEGG pathway enriched by the genes in the core component.

