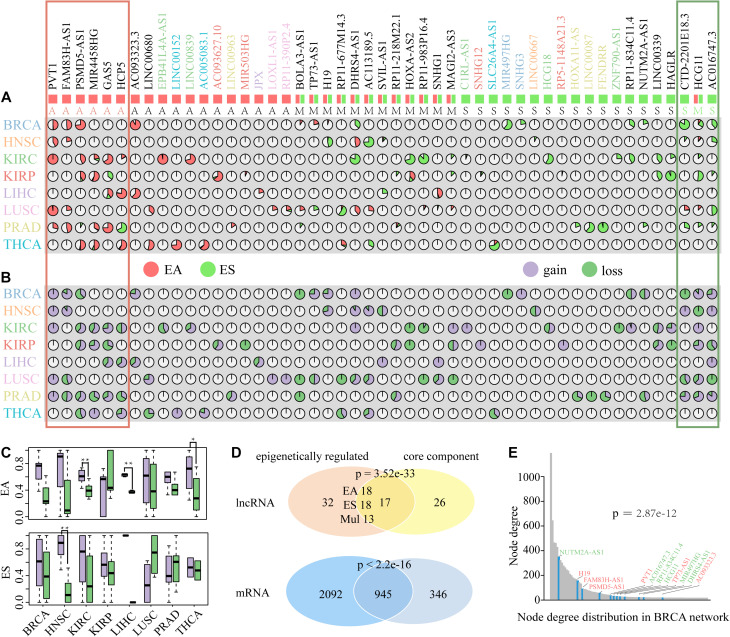
FIGURE 5.
The distribution and attribute of ER lncRNAs in DysCeNets. (A) Percentages of EA and ES lncRNAs in eight cancer types. Each pie chart indicates the percentage of each lncRNA epigenetic alteration in each cancer type. Red indicates EA lncRNAs, and green indicates ES lncRNAs. The symbol of lncRNAs with special color represents the lncRNA altered in a specific cancer type. Symbols below with A represented EA lncRNAs, S represented ES lncRNAs, and M represented multi-ER lncRNAs. The red frame represents the lncRNAs epigenetically activated in pan-cancer, and the green frame represents the lncRNAs epigenetically silenced in pan-cancer. (B) The property of edges linked to ER lncRNAs in DysCeNets. Each pie chart indicates the percentage of dysregulated status. Purple indicates gain interaction, and green indicates loss interaction. (C) The property of edge linked to EA and ES lncRNAs in DysCeNets. **P-value < 0.05, *P-value < 0.1. (D) The comparison of lncRNAs and related mRNAs between epigenetically related ceRNAs and core component. (E) The node degree distribution of top 100 ceRNAs in BRCA DysCeNet. The blue column represents the node degree of ER lncRNAs. The symbol colored red represents EA lncRNAs, and the symbol colored green represents ES lncRNAs.

