FIGURE 6.
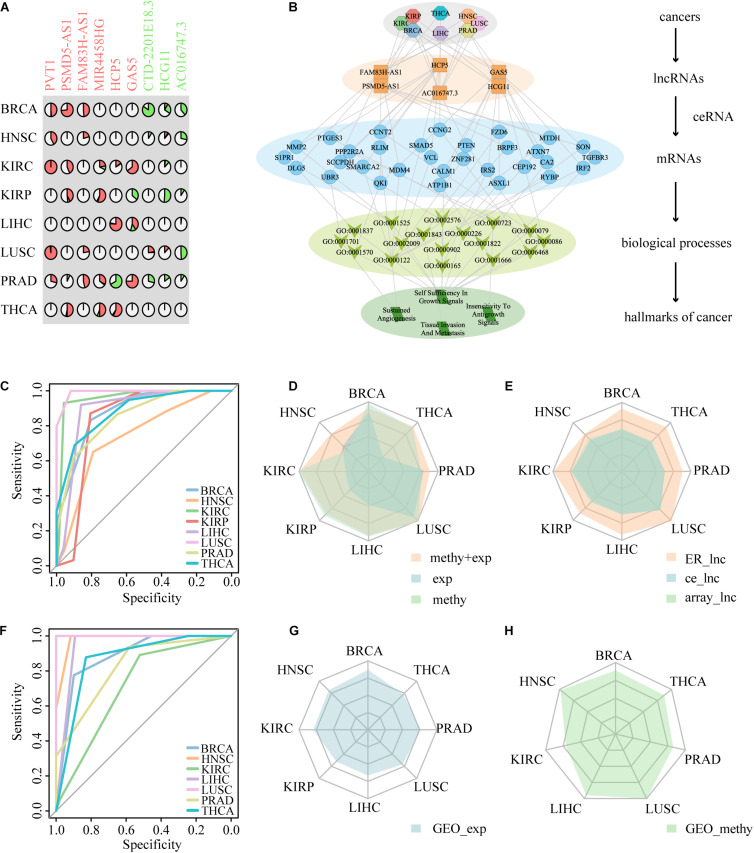
The performance of nine ER lncRNAs in distinguishing cancer patients from normal samples. (A) The layout of nine ER lncRNAs. The symbol of lncRNAs with red color represents the lncRNA epigenetically activated in pan-cancer, and the symbol of lncRNAs with green color represents the lncRNA epigenetically silenced in pan-cancer. (B) Summary of the hierarchical model to systematically understand the function of ER lncRNAs in DysCeNets. The model is laid out hierarchically with (from the top down) cancers, ER lncRNAs, mRNAs, annotated GO biological process terms, and hallmarks of cancers. (C) The ROC curve of ER lncRNAs based on two-dimensional datasets. (D) The performance of ER lncRNAs classifiers based on TCGA expression, TCGA methylation, and expression combined methylation levels. (E) The comparison of the classifiers among nine ER lncRNAs, nine lncRNAs randomly selected from DysCeNets, and nine lncRNAs randomly selected from expression/methylation profiles. (F) The ROC curve of ER lncRNAs based on the GEO methylation datasets. (G,H) The validated ER lncRNAs classifiers using external expression and methylation GEO datasets.

