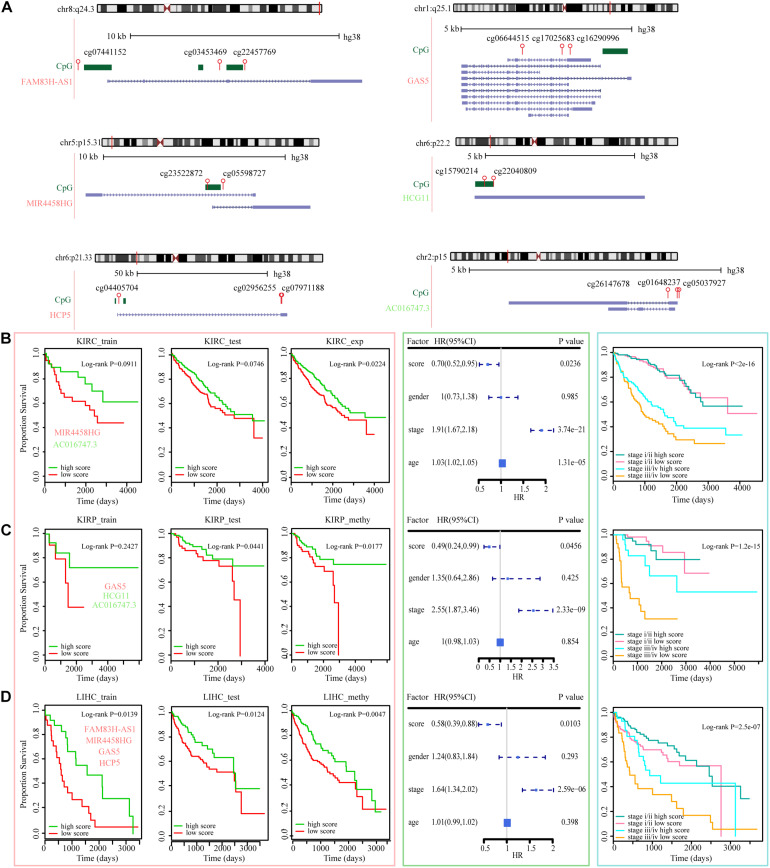
FIGURE 7.
ER lncRNAs as prognostic factors in various tumors. (A) The locations of ER lncRNAs occurred in three datasets (blue), CpG islands (green), and HM450 probes (red) in GRCh38 reference human genome. The symbol colored red represents EA lncRNAs, and the symbol colored green represents ES lncRNAs. (B–D) Kaplan–Meier estimates of OS of patients with KIRC expression, KIRP methylation, and LIHC methylation levels according to the ER lncRNA signature. Kaplan–Meier estimates of the OS of patients in train, test, and all sets according to the ER lncRNAs are shown in the left panel. The hazard ratios of clinical factors using a multivariate Cox regression model are shown in the middle panel. Kaplan–Meier estimates of the OS between low-stage and high-stage patients according to the ER lncRNAs are shown in the right panel.

