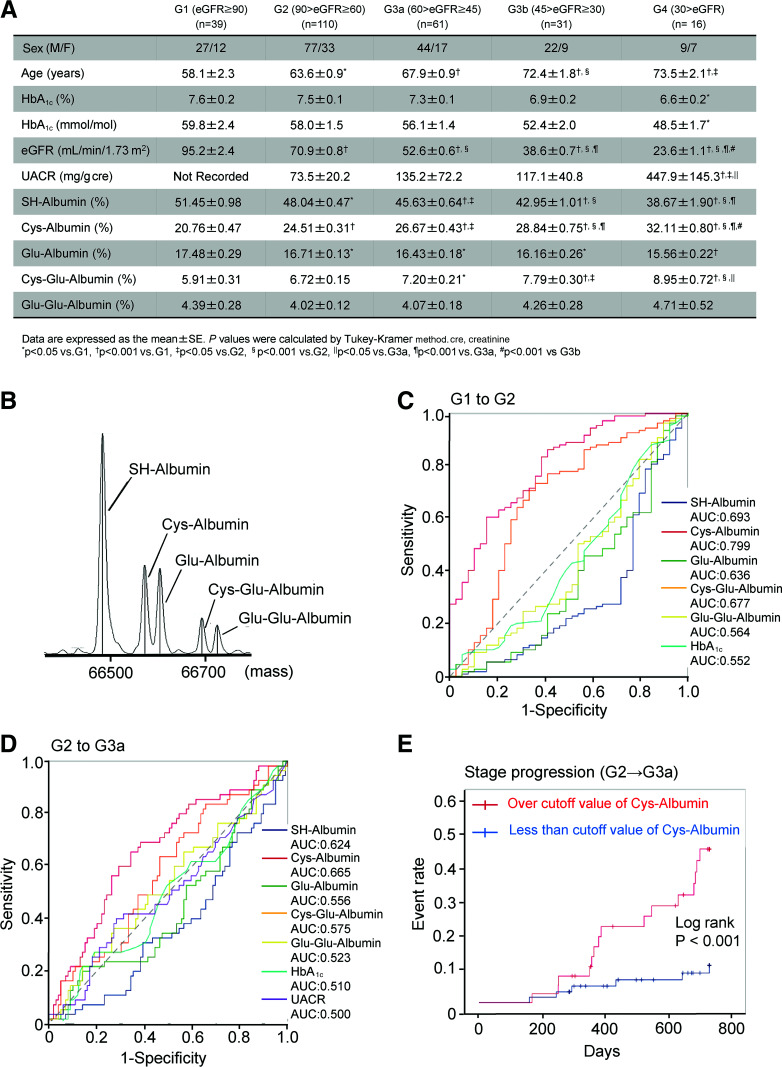
Figure 1.
A: Characteristics of patients enrolled in this study (n = 257; 179 men, 78 women). B: The mass peaks of each posttranslational form of serum albumin in patients with type 2 diabetes. C and D: Receiver operating characteristics curve analysis of each posttranslational modified albumin, HbA1c, and UACR for predicting each nephropathy stage progression in patients with type 2 diabetes with G1 to G2 stage (C) and G2 to G3a stage (D). E: Kaplan-Meier curve analysis for occurrence of nephropathy stage progression (G2 to G3a) in patients with type 2 diabetes with G2 stage of nephropathy who were above or below the cutoff value of Cys-Albumin (log-rank test: P = 0.001).

