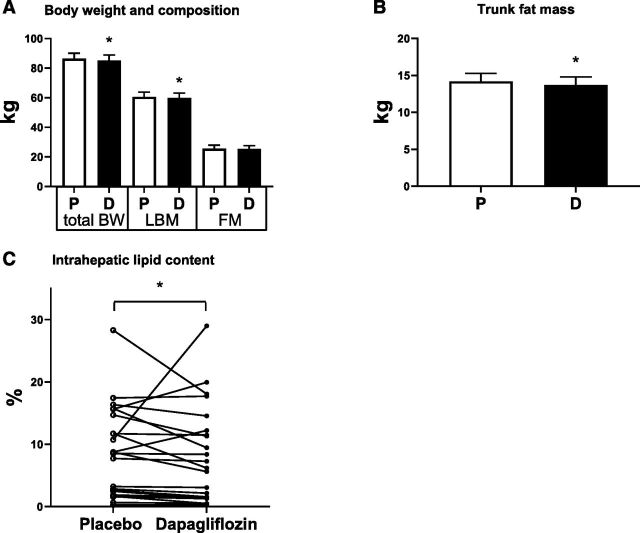
Figure 1.
Body composition (n = 24) (A), fat mass (n = 24) (B), and IHL (C) content upon placebo (P) and dapagliflozin (D) treatment (n = 22). BW, body weight; FM, fat mass; LBM, lean body mass. Results are in LSM and 95% CI, obtained through a linear mixed model, with the exception of IHL, where a Wilcoxon paired rank sum test was used. *P < 0.05 is considered significantly different.

