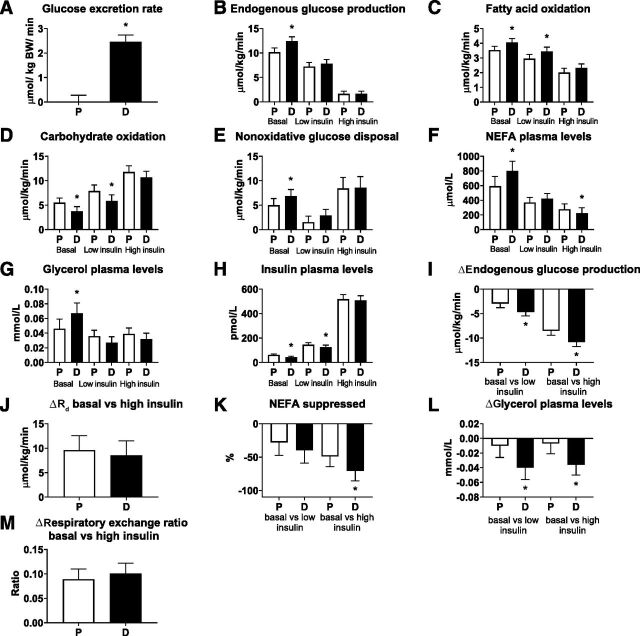
Figure 2.
Urinary glucose excretion (A), EGP (B), fatty acid (FA) oxidation (C), carbohydrate oxidation (D), NOGD (E), plasma NEFA levels (F), plasma glycerol levels (G), plasma insulin levels (H), ΔEGP (I), ΔRd (J), percentage of NEFA suppression (K), Δsuppression of glycerol plasma levels (L), and ΔRER (M) measured during a two-step EHC upon placebo (P) and dapagliflozin (D) treatment. Results (n = 22) are in LSM and 95% CI, obtained through a linear mixed model. *P < 0.05 is considered significantly different.

