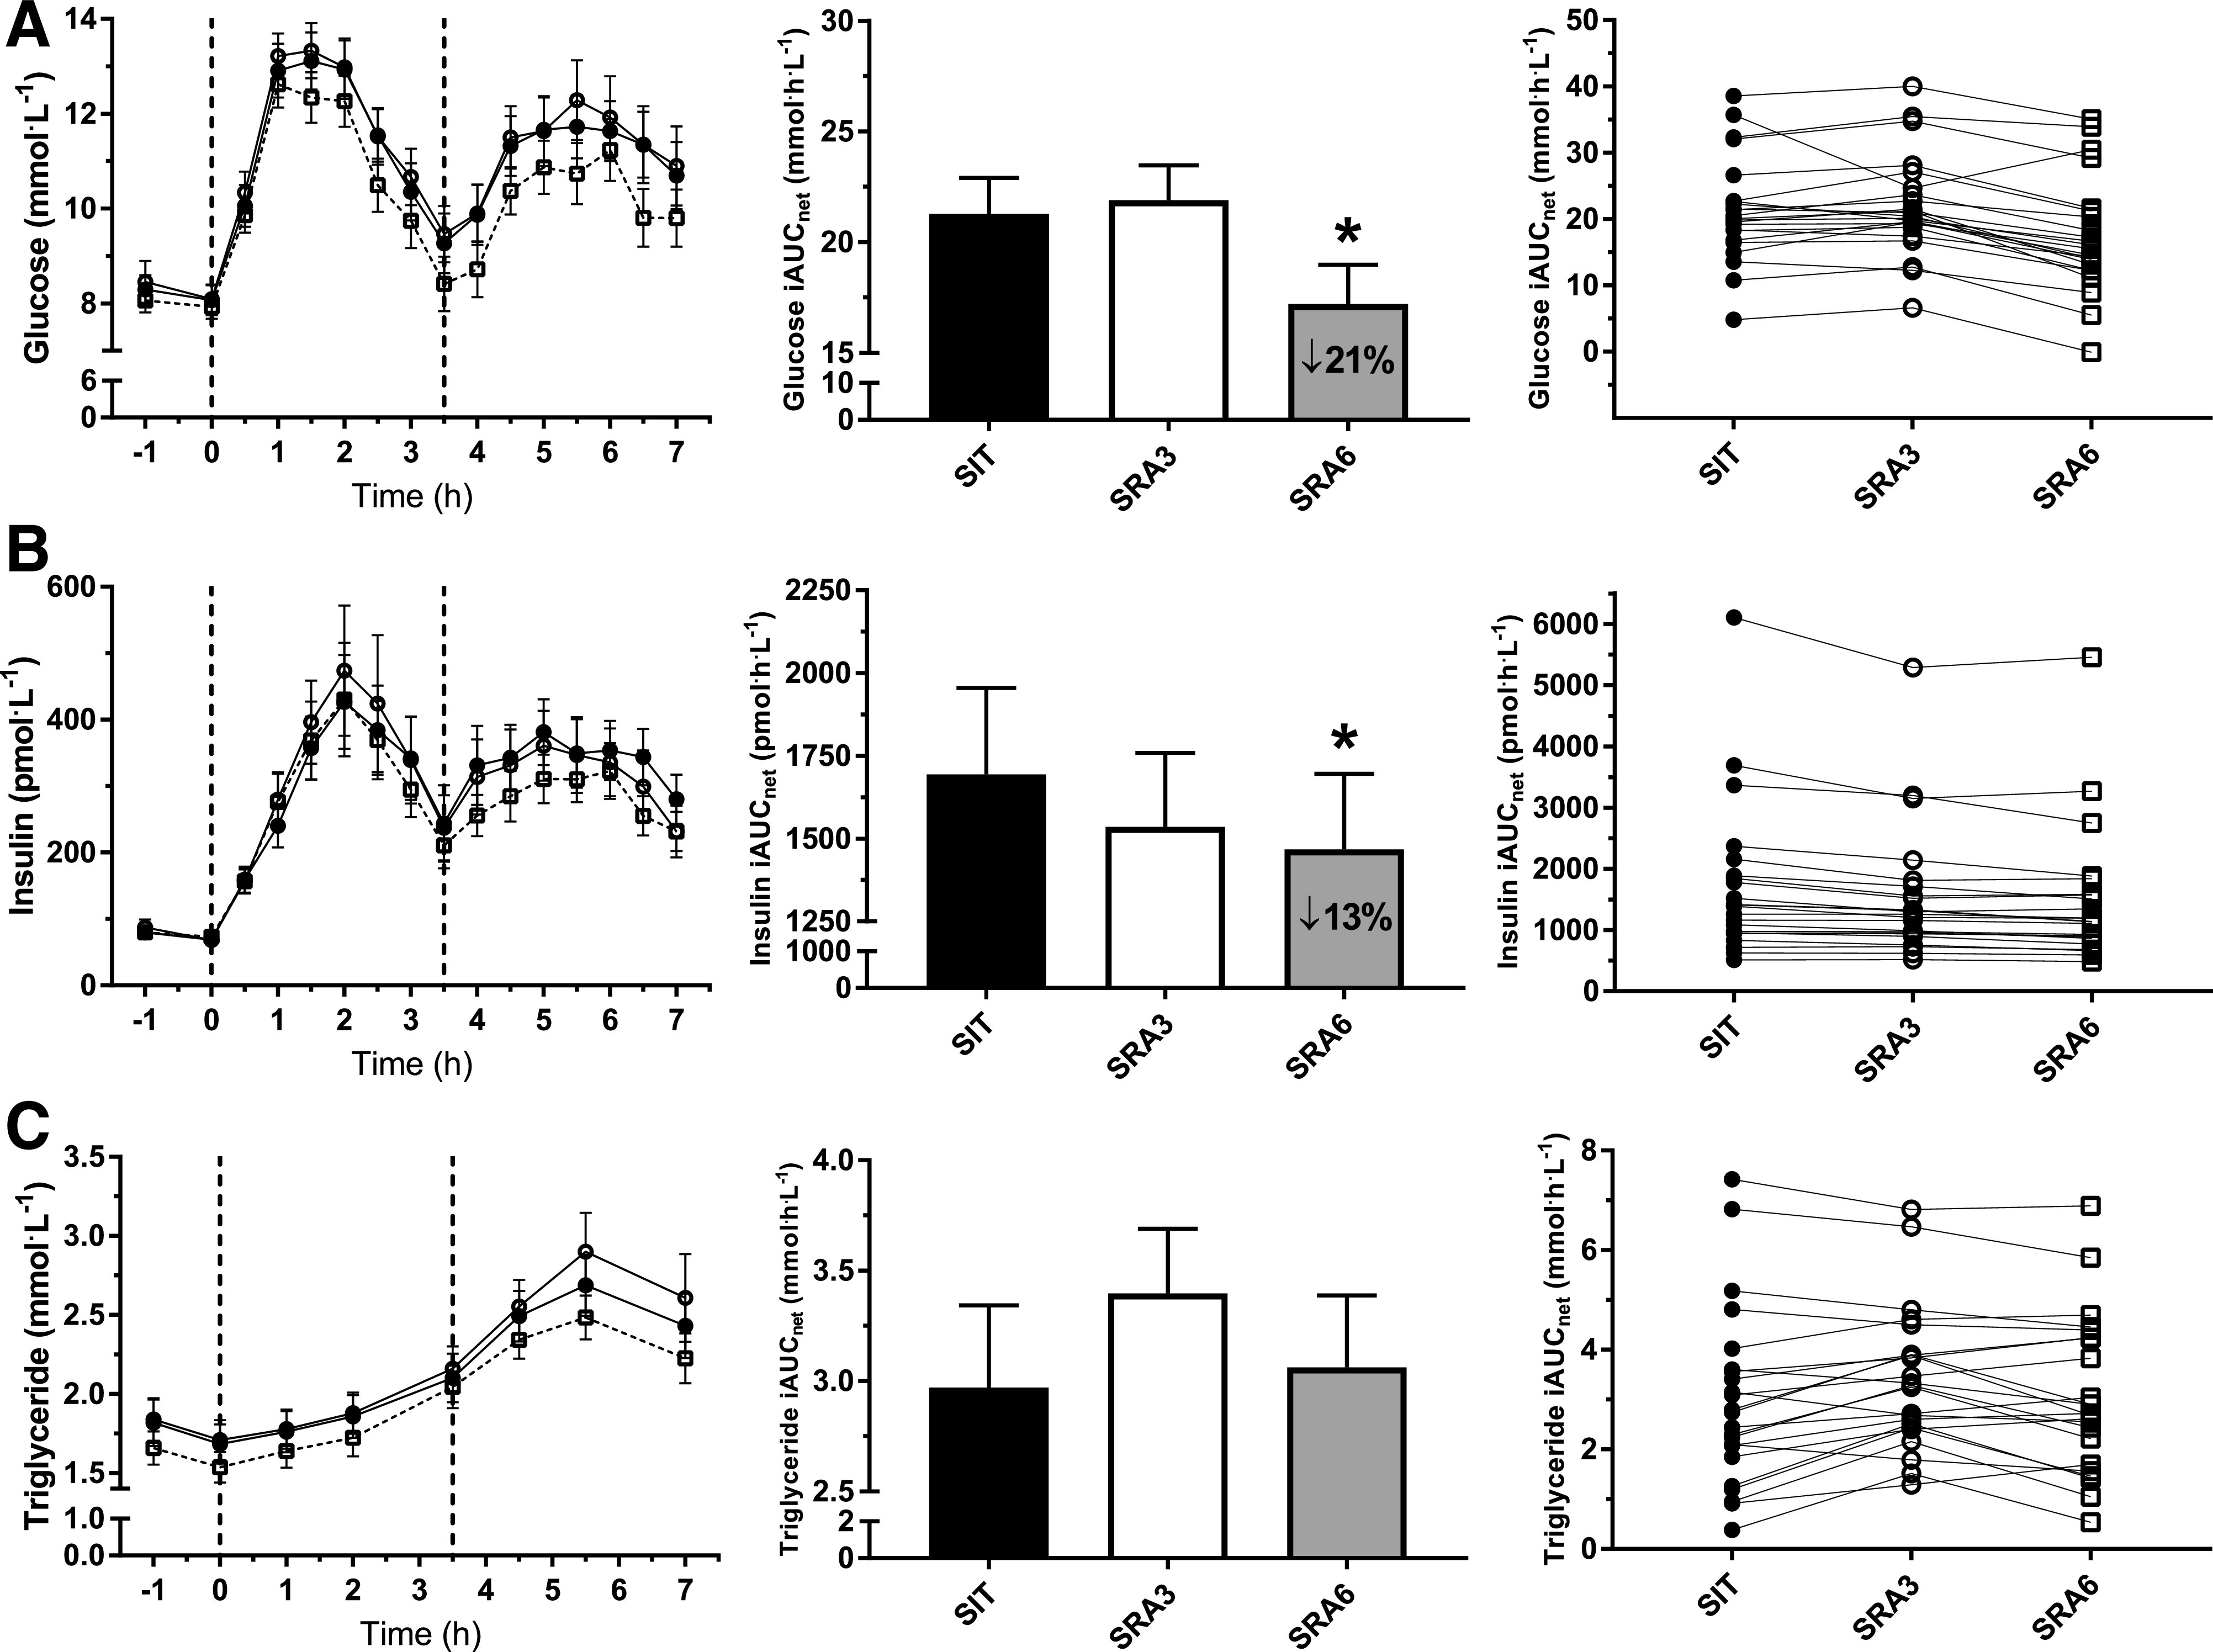
Figure 3.

—Postprandial plasma glucose (A), plasma insulin (B), and plasma triglyceride (C) concentrations measured during SIT (●) and sitting interrupted with SRA breaks of 3 min (○) or 6 min (□). Vertical dashed lines indicate timing of the breakfast (0 h) and lunch (3.5 h) meals. Data are presented as means ± SEM. From left to right: mean time course responses, mean iAUCnet, and individual iAUCnet responses. *Difference from uninterrupted sitting (P < 0.05).
