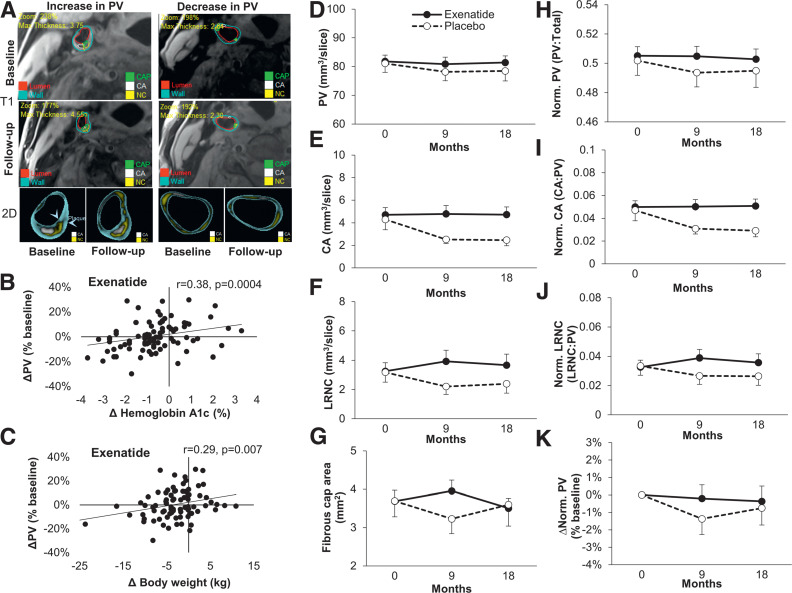
Figure 3.
Representative images (T1 and two-dimensional [2D]) of carotid wall from individuals with increased and decreased plaque volume (PV) (panel A); the association of changes in HbA1c and body weight with PV in the exenatide group (panels B and C); the effects of exenatide once weekly and placebo on plaque volume (panel D [primary outcome]), plaque components (calcified plaque [panel E] and LRNC [panel F]), fibrous cap overlying LRNC in those with LRNC >0 (panel G), and normalized plaque volume and plaque components (panels H–J); and percent change in normalized plaque volume in those with ≥80% compliance with study medication (per-protocol analysis [panel K, % change from baseline values]). Data are means ± SE. R values are Spearman correlation coefficients. CA, calcified plaque; LRNC, lipid-rich necrotic core; Norm., normalized.

