
Figure 2.
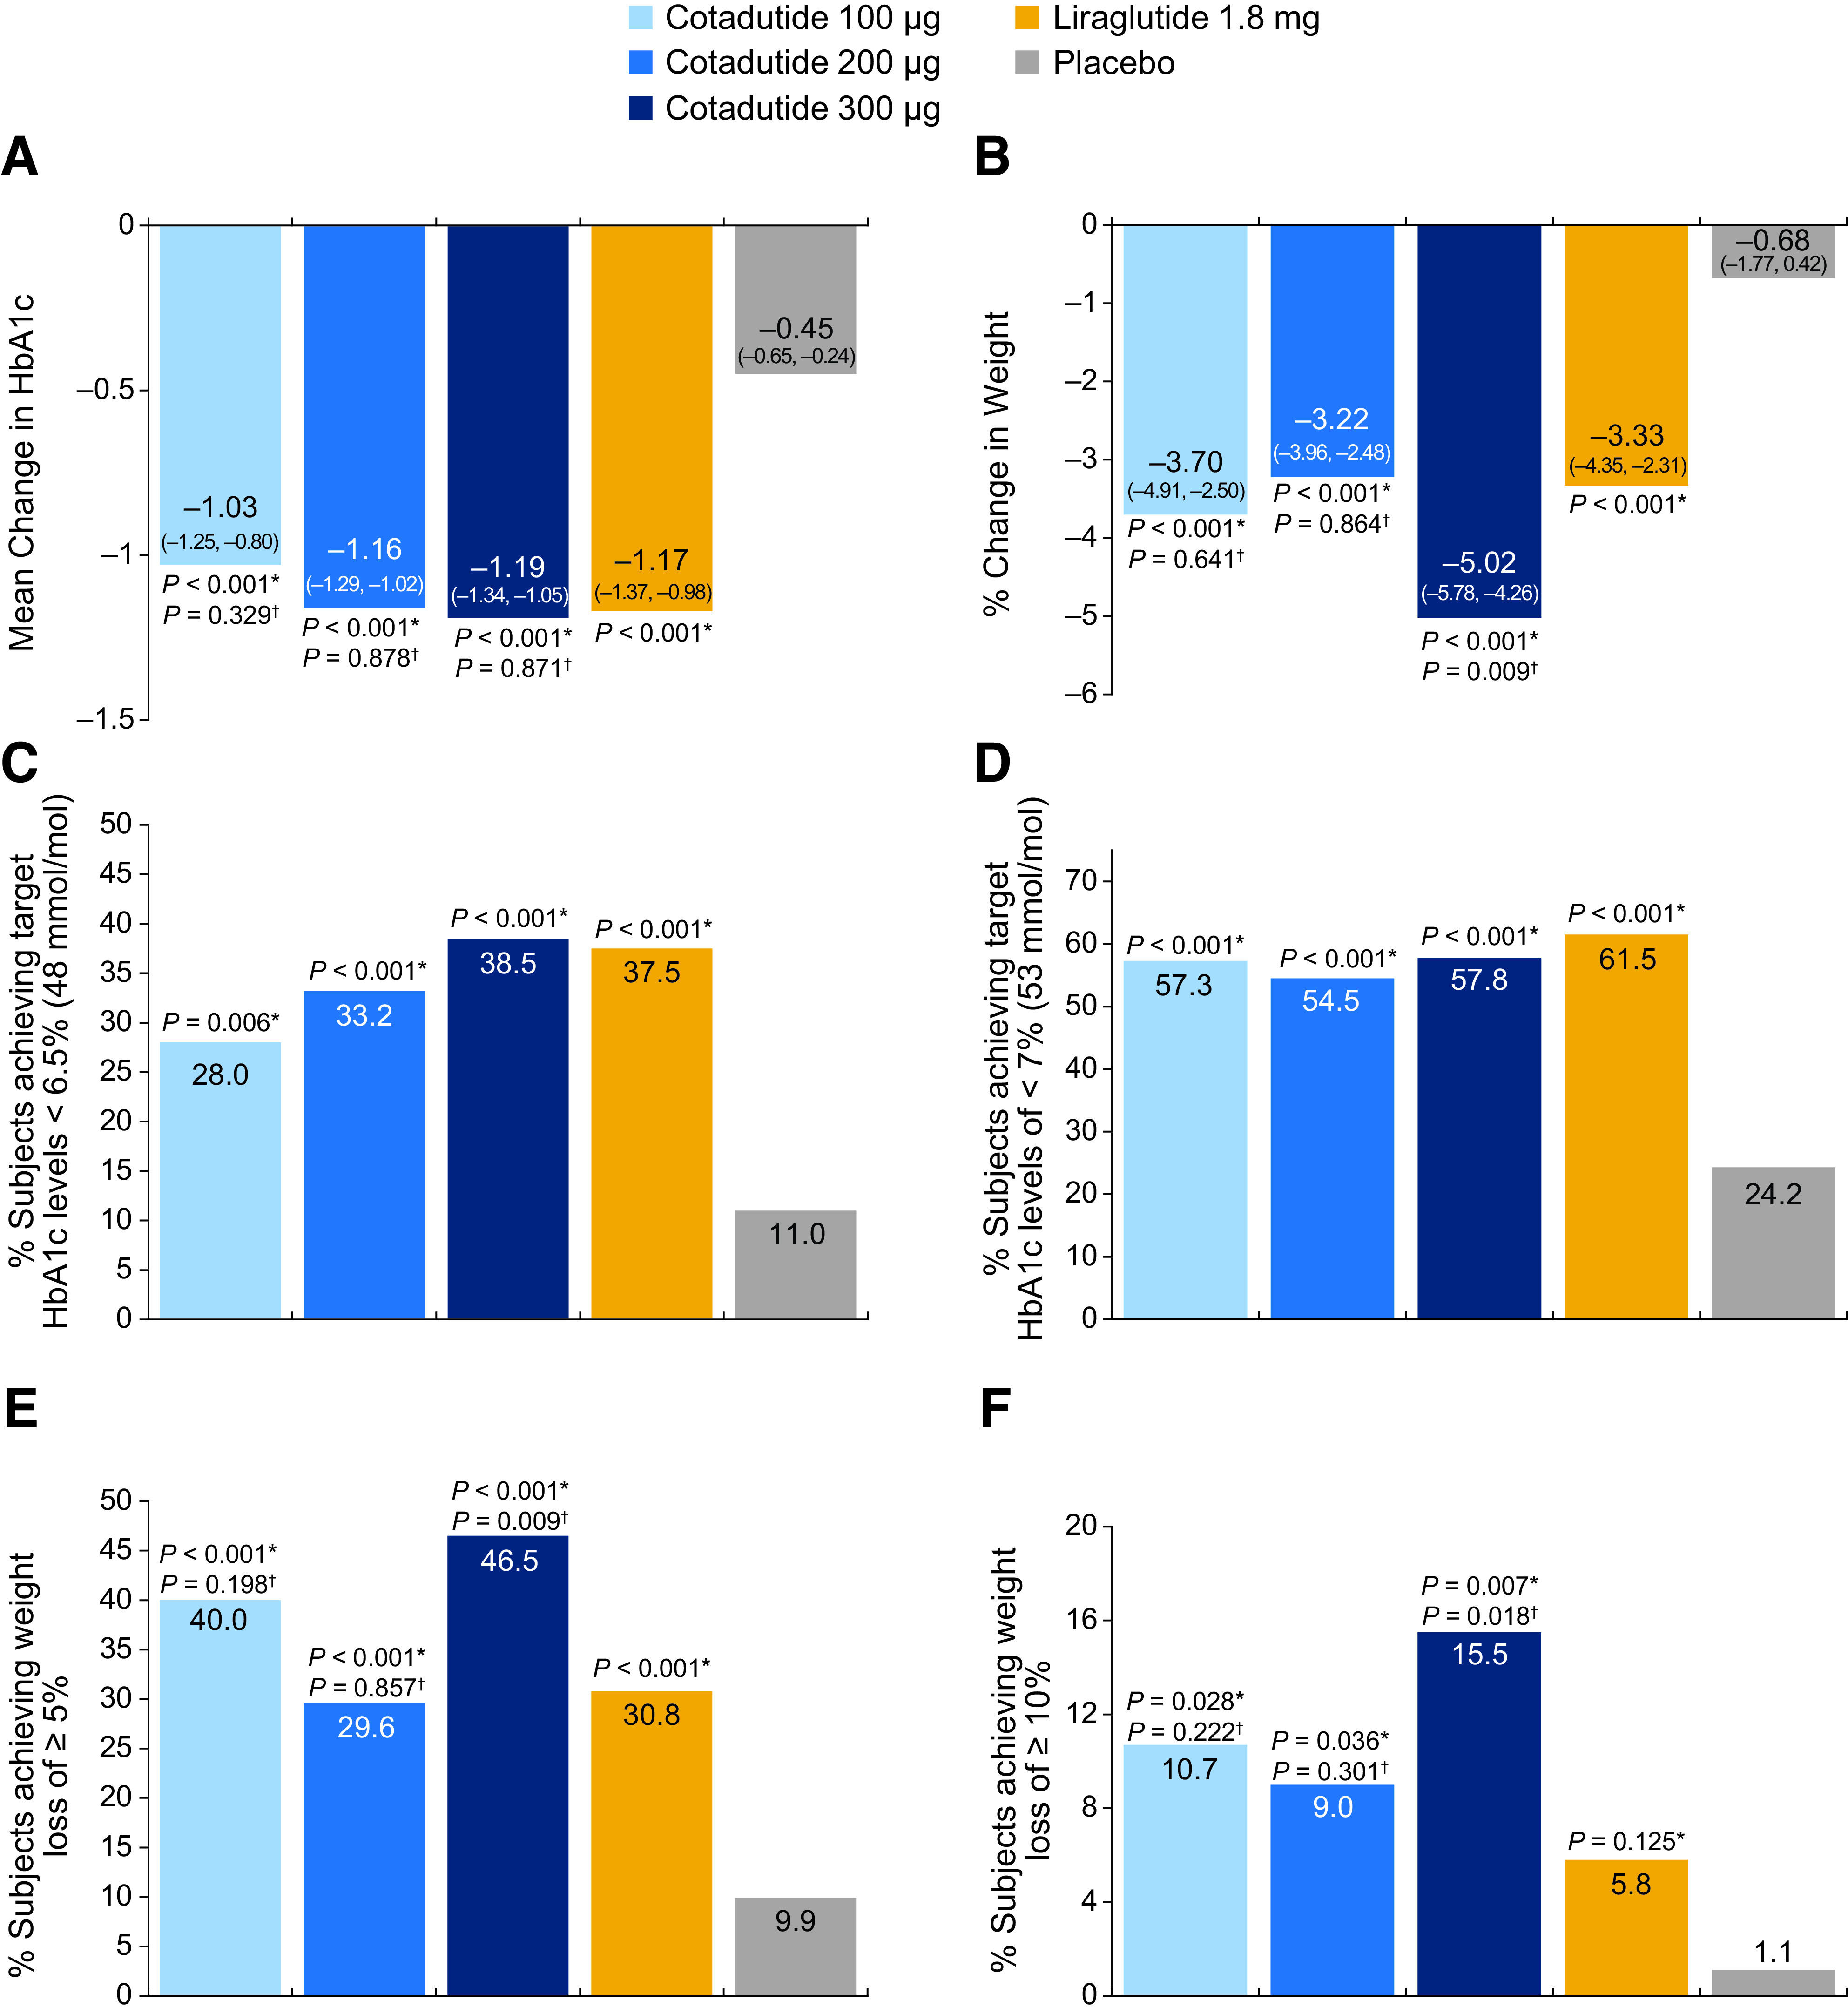
Changes in glycemic and body weight outcomes from baseline to week 54. A: Change in HbA1c levels. Data are LS means (95% CI). B: Percentage change in body weight. Data are LS means (95% CI). C: Percentage of participants achieving HbA1c levels of <6.5% (48 mmol/mol). D: Percentage of participants achieving HbA1c levels of <7% (53 mmol/mol). E: Percentage of participants achieving weight loss of ≥5%. F: Percentage of participants achieving weight loss of ≥10%. *Vs. placebo. †Vs. liraglutide. All data include the per-protocol population.