
Figure 4.
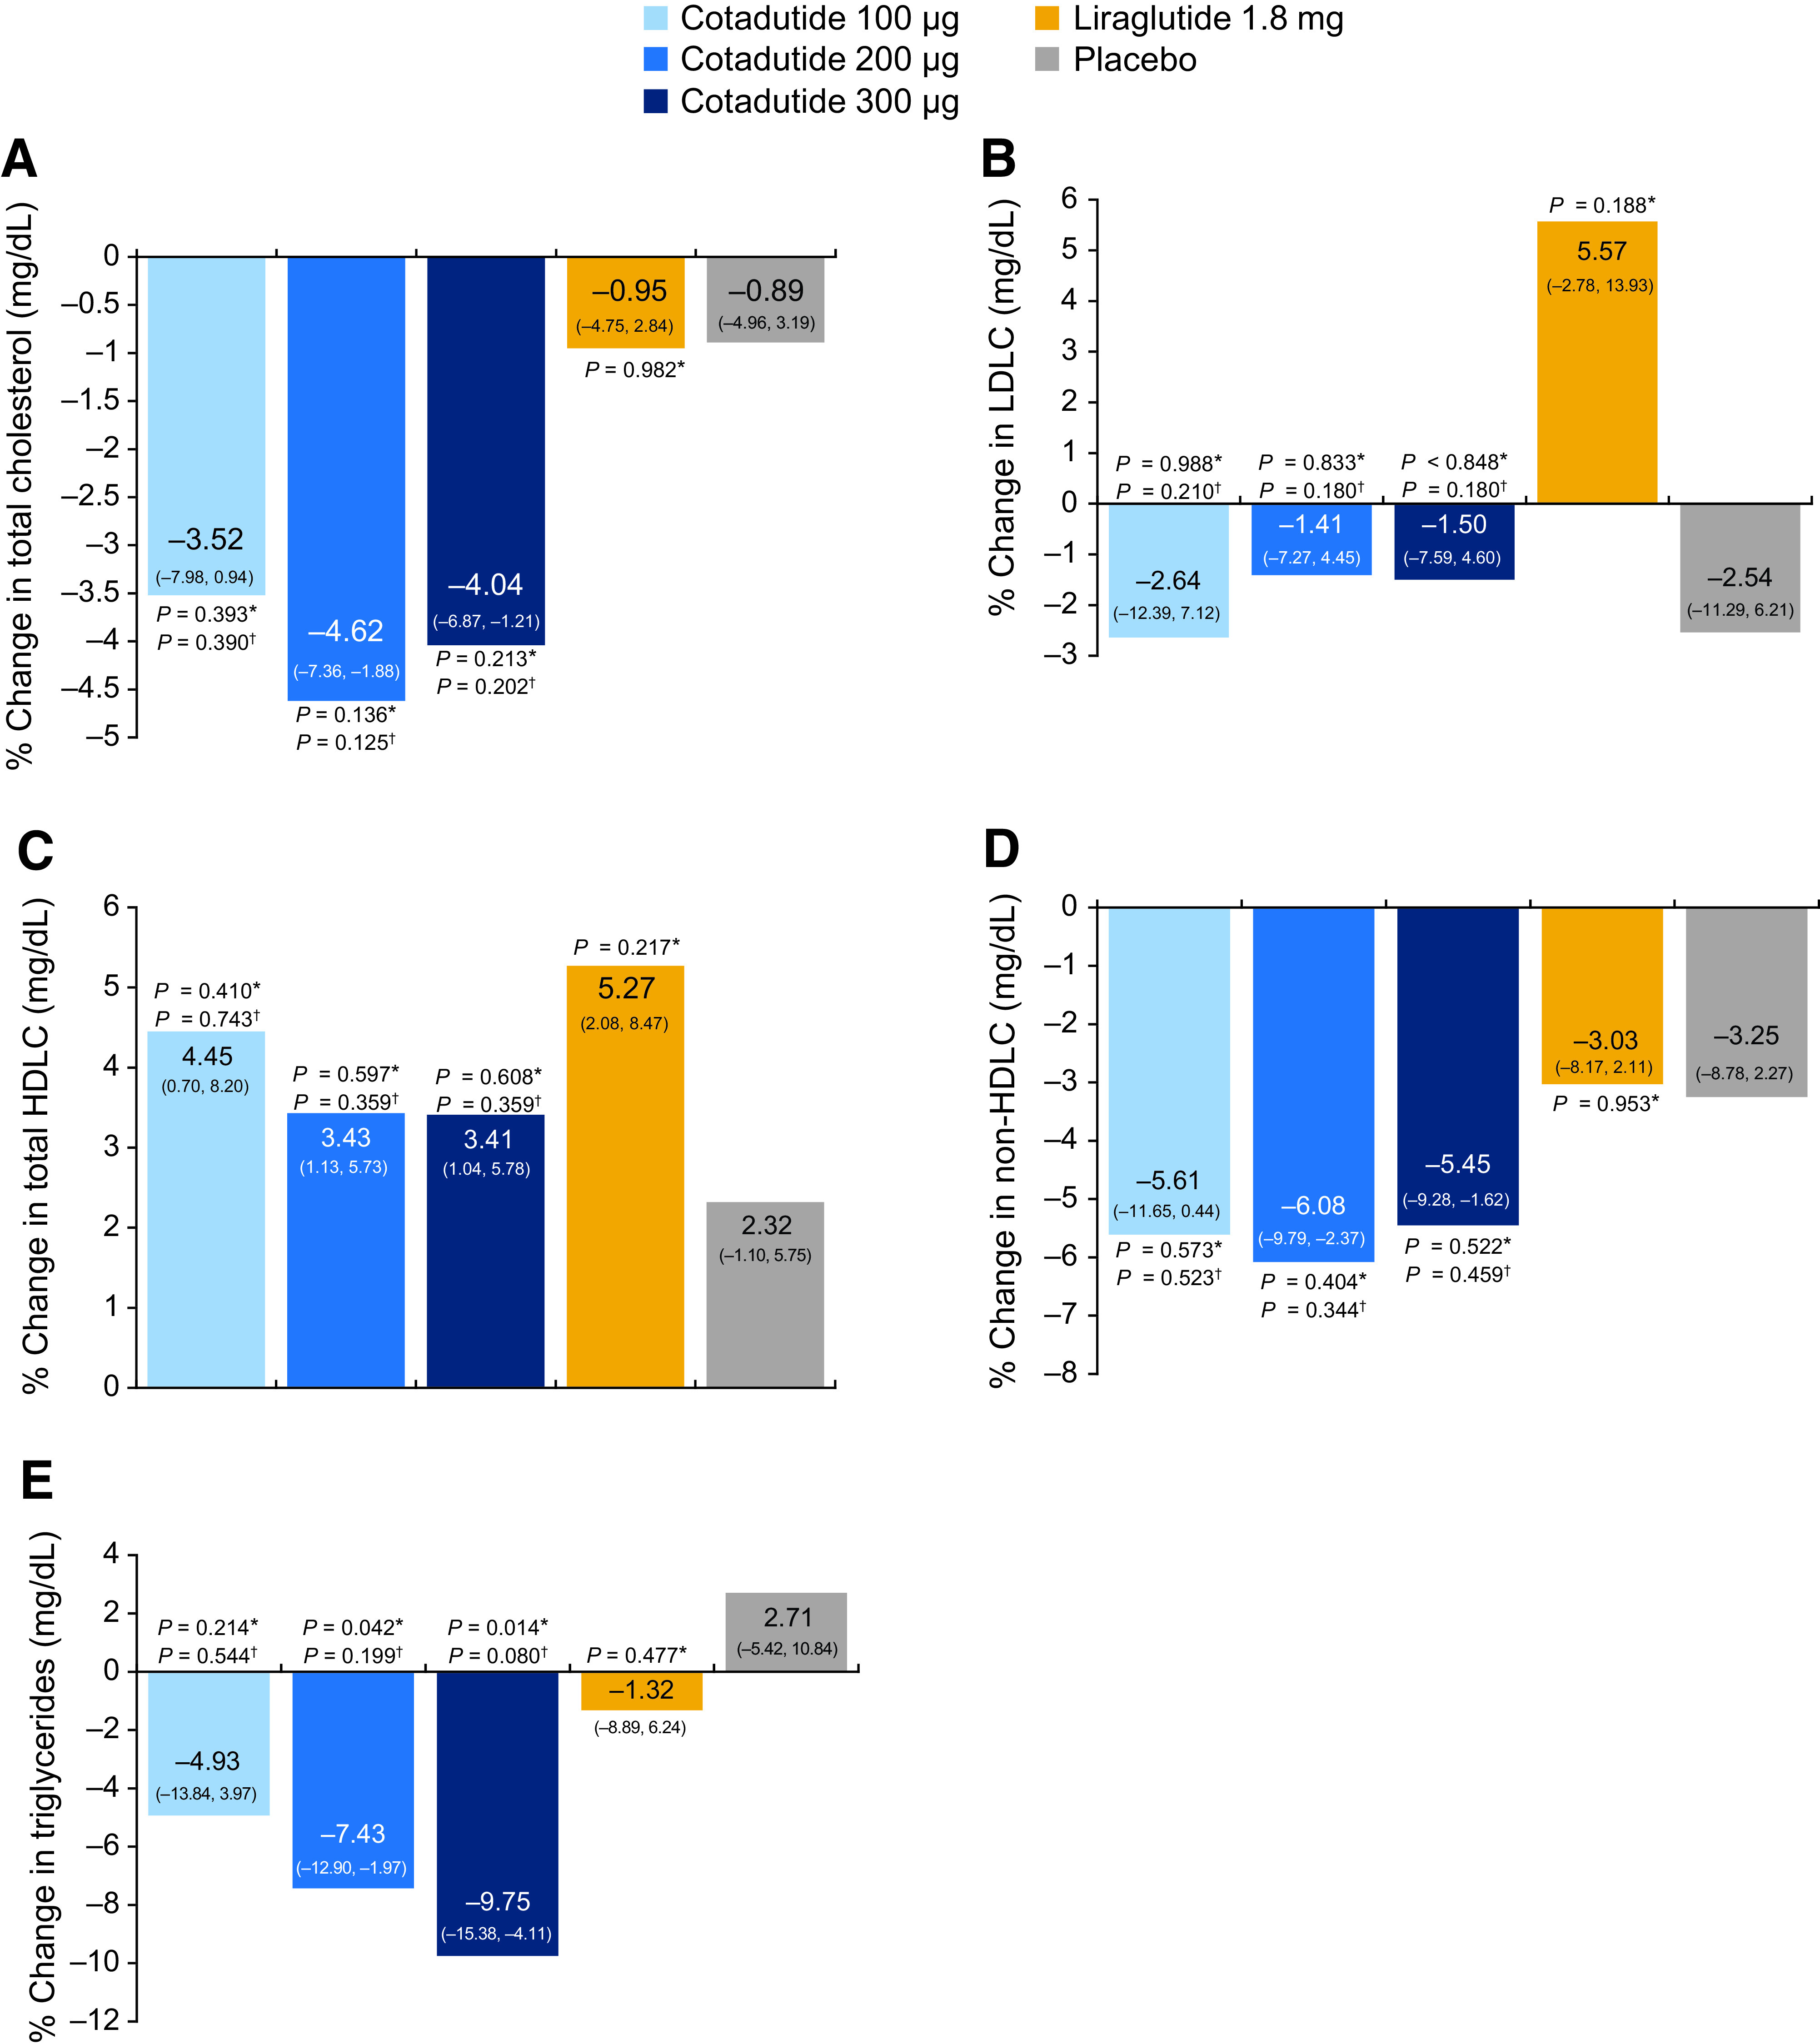
Percent change in secondary end points from baseline to week 54. A: Levels of total cholesterol. B: Levels of LDL cholesterol (LDLC). C: Levels of HDL cholesterol (HDLC). D: Levels of non-HDL cholesterol. E: Levels of triglycerides. *Vs. placebo. †Vs. liraglutide. Data are per-protocol population and are presented as LS means (95% CI).