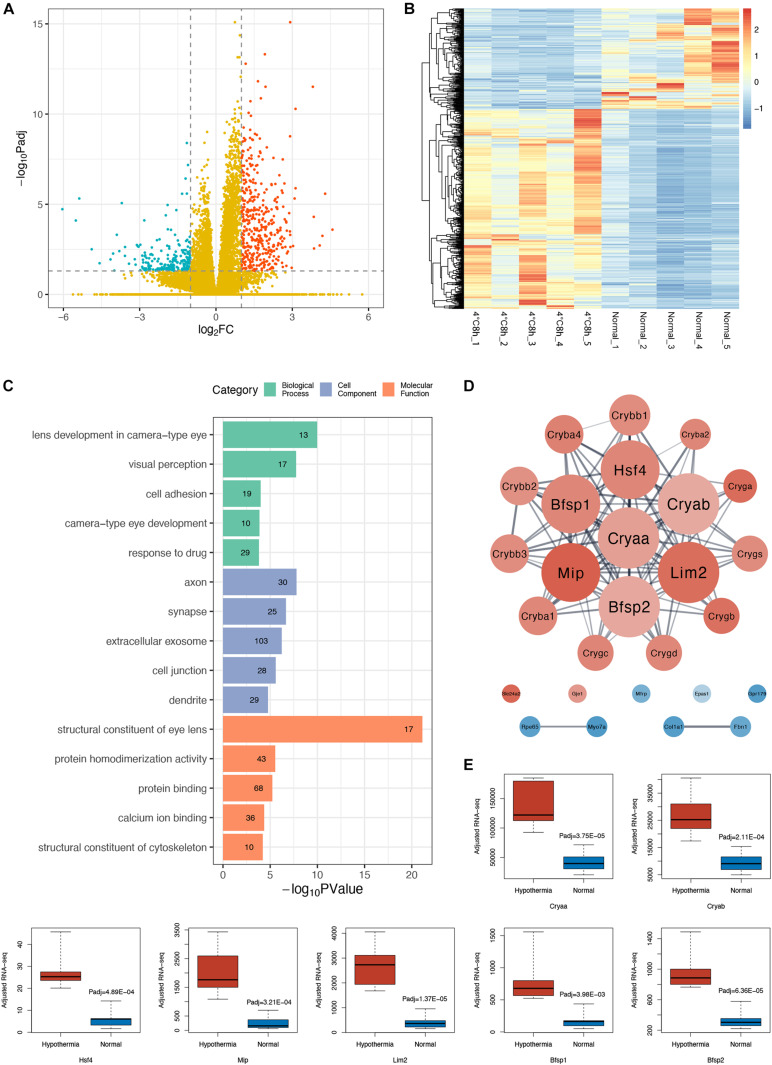
FIGURE 2.
Analysis of transcriptomic changes in cold treated lens capsules. (A) Volcano plots depict the log2FoldChange and statistical significance (|log2FoldChange| > 1), with the adjusted P-value expressed as −log10(adjusted P-value), the P-values were adjusted using the Benjamini and Hochberg method. Red points, green points, and yellow points represent up-regulated genes, down-regulated genes, and non-differentially expressed genes, respectively. (B) Heatmap of differentially expressed genes (DEGs) in the 10 samples. (C) Gene ontology (GO) analysis bar plot of DEGs. The top five GO terms with the lowest FDR values within each subcategory (BP, CC, MF) are listed. The number of DEGs annotated to the GO terms are shown on the bars. (D) Protein-protein interaction (PPI) network of DEGs annotated to the GO terms related to eyes. (E) Comparison of gene expression level of the hub genes in the PPI network between the two groups, adjusted RNA-seq means FPKM.

