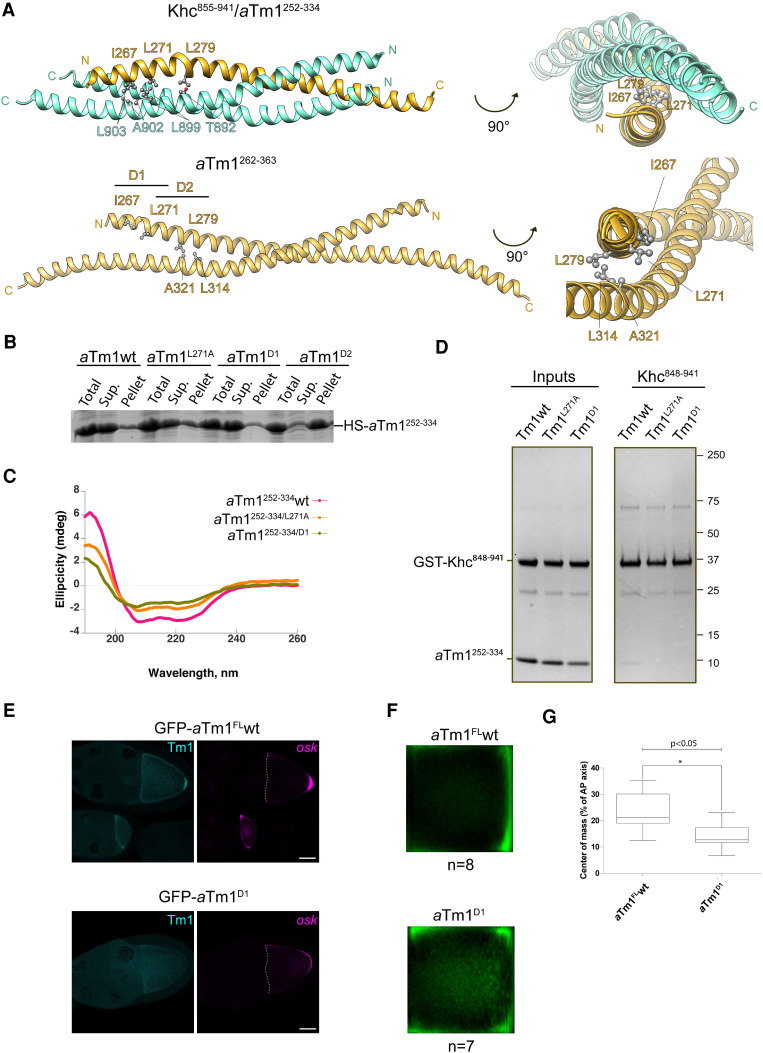
Figure 6.
Mutational analysis of the aTm1–Khc interaction. (A) Designing double point mutations at the hydrophobic core of aTm1–Khc coiled coil. Ribbon views of aTm1–Khc complex (top panels) or aTm1 homodimer (bottom panels) in two different orientations. Three residues—I267, L271, and L279—at the hydrophobic core of the trimeric complex are highlighted. In aTm1D1, residues I267 and L271 are mutated to alanine. In aTm1D2, residues L271 and L279 are mutated to alanine. (B) aTm1D2 has significantly reduced solubility. Total, supernatant, and pellet fractions of E. coli lysate with recombinantly expressed His-SUMO tagged aTm1252–334 wild-type and mutant variants were analyzed on SDS-PAGE and stained with Coomassie. (C) aTm1D1 has the characteristic coiled-coil fold. (Magenta) CD analysis of aTm1wt, (orange) aTm1L271A , (green) aTm1D1. (D) aTm1D1 mutation causes strong reduction of the interaction with Khc. Pull-down assays of GST-tagged Khc848–942 with different variants of aTm1252–334. (Left panel) Purified aTm1 variants were mixed in excess with Khc848–942, immobilized on GSH beads. (Right panel) After incubation and extensive washing, the eluates were analyzed on SDS-PAGE and stained with Coomassie. (E) Tm1D1 causes oskar mRNA localization defects in vivo. (Left panels) Egg chambers (stage 9) from flies expressing GFP-aTm1-FL and GFP-aTm1D1 in the Tm1eg9 /Tm1/eg9 background. (Right panels) oskar mRNA was detected by smFISH. Scale bar, 25 µm. (F) Mean oskar distribution (green) in stage 9 oocytes from the flies in E. n corresponds to the number of analyzed oocytes. (G) Position of oskar mRNA center of mass relative to the geometric center of the oocyte, represented in box plot with minimum and maximum whiskers. GFP-aTm1FL wt panels and quantification in E–G are the same as in Figure 3.

