Figure 1.
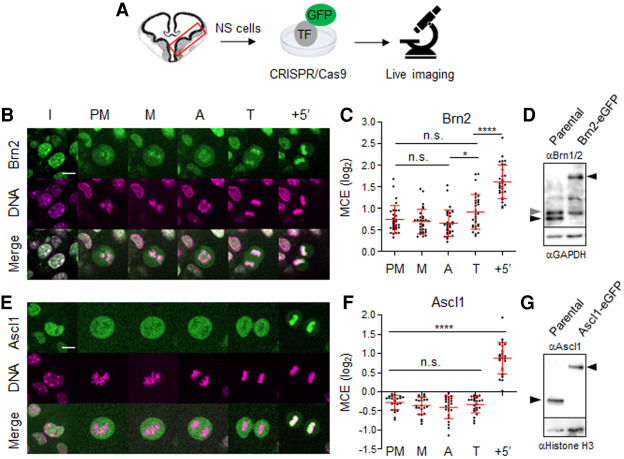
Brn2 and Ascl1 display distinct interactions with condensed chromosomes in proliferating NS cells. (A) Adherent cultures of mouse embryonic neural stem/progenitors of ventral telencephalon expressing eGFP-tagged Ascl1 or Brn2 were live imaged undergoing proliferative divisions. (B,E) Time-lapse live-cell imaging of NS cells expressing eGFP-tagged Brn2 (B) and Ascl1 (E) in presence of DNA dye SiR-Hoechst. (C,F) Quantifications of mitotic chromosome enrichment levels (MCEs) at different stages in NS cells expressing Brn2-eGFP (n = 30) and Ascl1-eGFP (n = 24). Data shown as mean ± SD. One-way ANOVA Tukey's multiple test was used to compare MCE levels across different stages. (n.s.) P > 0.05, (*) P ≤ 0.05, (****) P ≤ 0.0001. Not shown in the figure: MCE comparison between TFs at each stage; P ≤ 0.0001. (D,G) Western blot analysis of Brn2-eGFP (D) and Ascl1-eGFP (G) protein expression in lines used in live imaging and their counterparts in parental NS cells. Black arrows mark specific bands corresponding to endogenous or eGFP fusion proteins. Gray arrow marks Brn1, also recognized by the antibody used (see Supplemental Fig. S2 for characterization of Brn2 commercial antibody). (I) Interphase, (PM) prometaphase, (M) metaphase, (A) anaphase, (T) telophase. Scale bars, 10 µm.

