Figure 3.

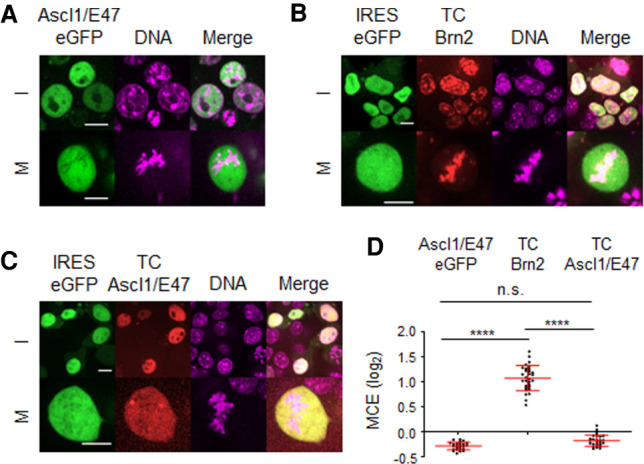
Tetracysteine tag-based live-cell imaging confirms distinct abilities of Ascl1 and Brn2 to interact with mitotic chromosomes. (A–C) Representative captures from live-cell imaging of P19 cells expressing Ascl1/E47-eGFP (A), TC-Brn2-IRES-GFP (B), or TC-Ascl1/E47-IRES-GFP (C) in the presence of DNA dye SiR-Hoechst. (D) Quantifications of mitotic chromosome enrichment levels of all three conditions, measured using cells undergoing metaphase (n = 25 in Ascl1/E47-eGFP; n = 30 in TC-Brn2; n = 26 in TC-Ascl1/E47). Data shown as mean ± SD. (I) Interphase, (M) mitosis. Scale bars, 10µm.
