Figure 5.
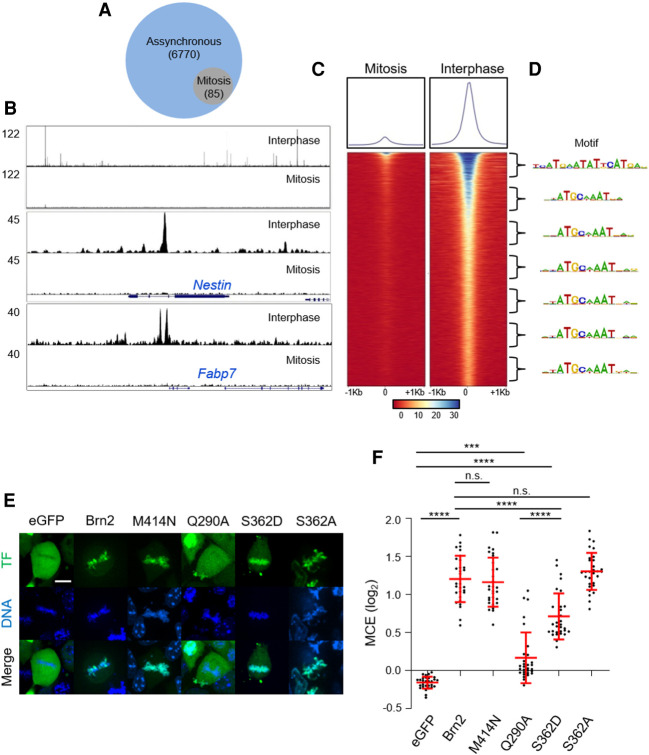
Brn2 mitotic chromosome binding is not mediated by sequence-specific interactions. (A) Venn diagram depicting the number of genomic regions bound by Brn2 in mitotically synchronized (95% purity sample) or unsynchronized cultures, as determined by ChIP-seq. (B, top panel) ChIP-seq Brn2 binding profile in a large region of chromosome 12 showing multiple peaks found in unsynchronized sample, but no binding in mitosis. (Middle and bottom panels) Brn2 binding was found at expected regions within previously characterized neural enhancers in Nestin and Fabp7 genes, only in the interphase sample. (C) Density plot of ChIP-seq reads from mitotic and interphase samples, mapping to genomic regions centered on Brn2 peak summits found in interphase. Signal intensity represents normalized tag count, ordered by increasing P-values. (D) A bin-by-bin search for enriched DNA-binding motifs centered at Brn2 peak summits identifies the MORE motif as the highest enriched on the top 1000 peaks, while the octamer motif is most enriched in other bins. (E) Representative captures from live-cell imaging of P19 cells expressing eGFP fusion proteins of full-length Brn2, or Brn2 mutants with point mutations that disrupt homodimerization (M414N), predicted to interfere with electrostatic interactions with DNA backbone (Q290A) or in a residue targeted by mitotic phosphorylation that hampers sequence-specific binding and results in phospho-dead (S362A) or phospho-mimetic (S262D) derivatives. Control eGFP is also shown. Cells were synchronized in metaphase using proTAME and Apcin and live imaged together with DNA staining Hoechst. (F) Quantifications of mitotic chromosome enrichment levels from live-imaging experiments shown in E. Data shown as mean ± SD (n = 30 for each condition). One-way ANOVA Tukey's multiple comparison test was performed. (n.s.) P > 0.05, (***) P ≤ 0.001, (****) P ≤ 0.0001. Scale bar, 10 µm.

