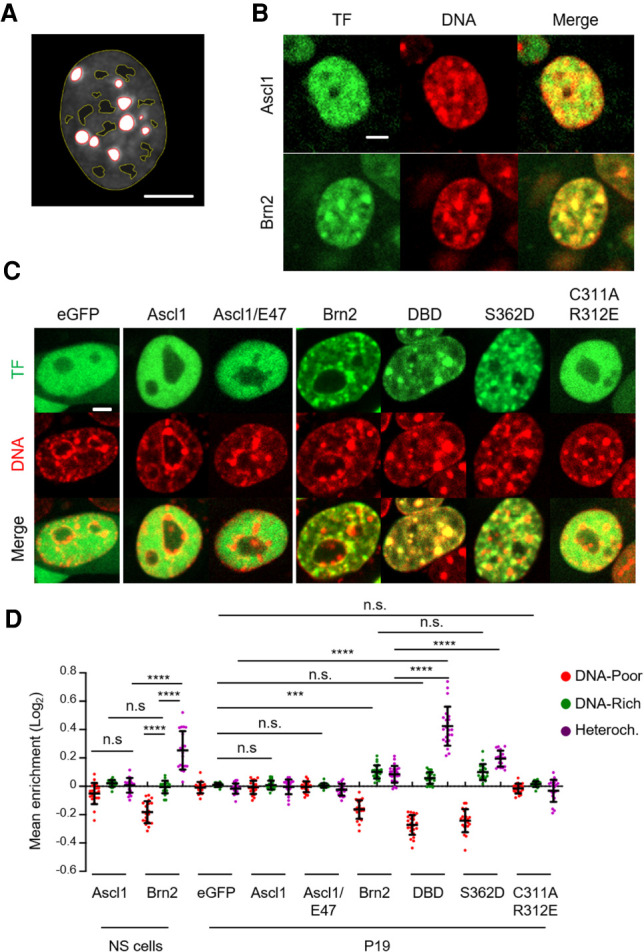
Figure 6.

Brn2 (but not Ascl1) associates with highly compacted DNA regions in the interphase nucleus. (A) Image depicting the segmentation of an NS cell nucleus into heterochromatic DNA regions (delineated in red), DNA-poor regions (delineated in yellow), and DNA-rich regions (space in between). (B) Representative captures from live-cell imaging of eGFP-tagged Ascl1- and Brn2-expressing NS cells, stained with Hoechst for segmentation into nuclear regions with different chromatin densities. (C) Representative captures from live-cell imaging of P19 cells expressing variants of Ascl1 and Brn2 eGFP fusion proteins as indicated in the figure, stained with Hoechst for segmentation into nuclear regions with different chromatin densities. (D) Quantification of imaging analyzes shown in B and C. Enrichment levels at different segmented DNA regions are shown as mean ± SD. n = 20 cells for most conditions; n = 24 cells for Brn2 and DBD both in P19 cells. One-way ANOVA Tukey's multiple comparison test was performed. (n.s.) P > 0.05, (***) P ≤ 0.001, (****) P ≤ 0.0001. Scale bars, 5µm.
