Figure 7.
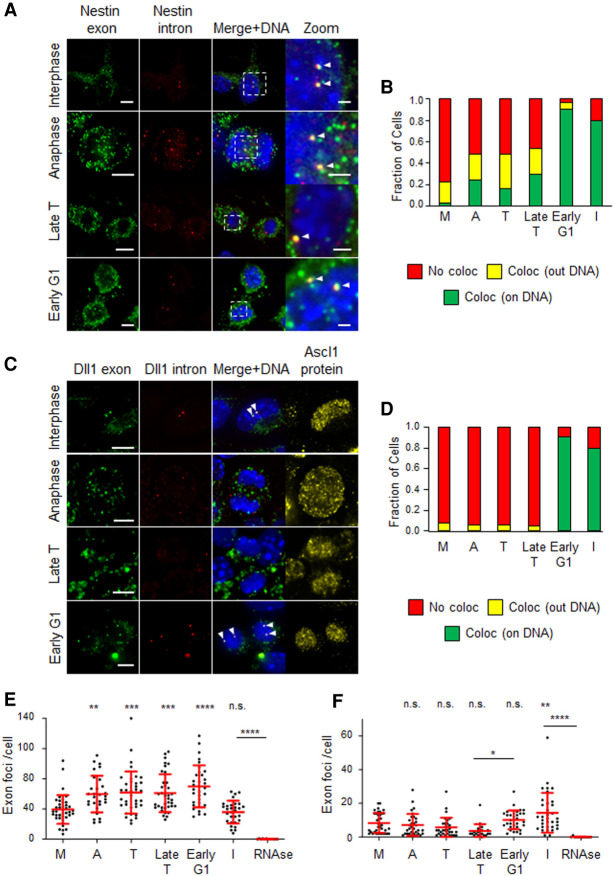
Targets of Brn2 (Nestin) and Ascl1 (Dll1) show distinct kinetics of transcriptional reactivation during M-G1 transition in proliferating NS cells. (A) Representative images of cells in interphase, anaphase, late telophase, and early G1 stained by smRNA-FISH using exonic (FAM) and intronic (Q570) probes for Nestin transcript. Images shown are maximum intensity projections of six optical planes with 0.3-µm Z step intervals, with white arrowheads marking spots of colocalized intron–exon probe signal found on DNA (stained with DAPI) Scale bars, 5 µm. (B) Stacked bar plots showing the fractions of cells containing at least one spot of colocalized intron–exon probe signal found on DNA (green), outside DNA (yellow), or without colocalization spots (red; n = 40 in metaphase; n = 29 in anaphase; n = 37 in telophase, n = 37 in late telophase; n = 32 in early G1; n = 30 in interphase; n = 12 in interphase + RNase). (C) Representative images of cells in interphase, anaphase, late telophase, and early G1 costained by smRNA-FISH using exonic (FAM) and intronic (Q570) probes for Dll1 transcript and by immunocytochemistry for Ascl1 protein. Images shown are maximum intensity projections of six optical planes with 0.3-µm Z step intervals, with white arrowheads marking spots of colocalized intron–exon probe signal found on DNA (stained with DAPI). (D) Stacked bar plots showing the fraction of cells containing at least one spot of colocalized intron/exon probe signal found on DNA (green), outside DNA (yellow), or without colocalization spots (red; n = 32 for metaphase, anaphase, telophase, early G1; n = 21 for late telophase; n = 34 for interphase; n = 11 for interphase + RNase). (E,F) Quantifications of exon probe signal per cell for Nestin (E) and Dll1 (F) transcripts at different stages during M-G1 transition, in experiments described in A–D. Quantification of RNase treated sample is included as control. One-way ANOVA Tukey's multiple comparison test was performed. (n.s.) P > 0.05, (*) P ≤ 0.05, (**) P ≤ 0.01, (***) P ≤ 0.001, (****) P ≤ 0.0001. (M) Metaphase, (A) anaphase, (T) telophase, (Late T) late telophase, (I) interphase. Data shown as mean ± SD. Scale bars, 5 µm (1 µm in high magnification)

