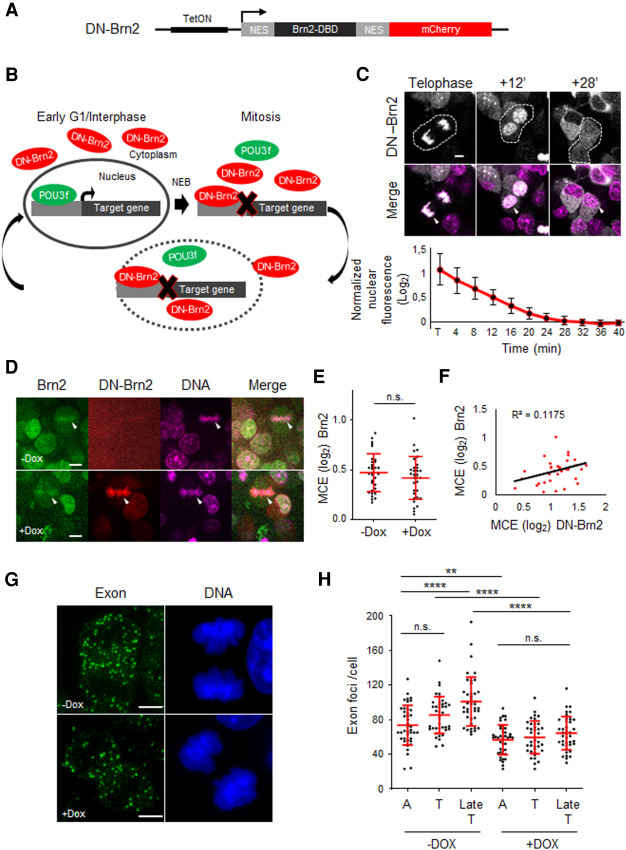
Figure 8.
Transcription reactivation of Nestin gene during M-G1 transition is dependent on Brn2 activity. (A) Experimental strategy whereby a mitotic-specific dominant-negative form of Brn2 (DN-Brn2), composed of its DBD flanked by nuclear export signal (NES) sequences and in fusion with mCherry, was expressed in NS cells under a Dox-inducible promoter. (B) Schematic depicting how DN-Brn2 competes with endogenously expressed POU3F family members for their binding sites in the presence or absence of the nuclear envelope (interphase and mitosis, respectively). (C) Time-lapse live-cell imaging of Dox-treated cells expressing DN-Brn2, from telophase until G1. White arrowheads show association of DN-Brn2 with mitotic DNA (labeled with SiR-Hoechst) during telophase and its cytoplasmic localization after nuclear envelope reformation. Quantification of nuclear export kinetics of DN-Brn2, normalized to interphase levels, is shown below. n = 11 cells. (D) Representative captions from live-cell imaging of DN-Brn2-NS cells in the absence (top) or presence (bottom) of Dox. White arrowheads indicate an example of a metaphase plate in each condition. DNA labeled with SiR-Hoechst. (E) Quantification of MCE of Brn2-eGFP in the presence (+Dox) or absence (−Dox) of DN-Brn2. Mann–Whitney test was performed. (n.s.) P > 0.05. n = 32 for each condition. (F) Correlation analysis between MCE levels of Brn2 and DN-Brn2. (G) Representative images of Dox-treated and -untreated NS cells in telophase stained by smRNA-FISH using an exonic (Q670) probe for Nestin transcript. DNA staining with DAPI. Images shown are maximum intensity projections of 12 optical planes with 0.3-µm Z step intervals. (H) Quantifications of exon probe signal per cell for Nestin transcript at different stages during M-G1 transition. One-way ANOVA Tukey's multiple comparison test was performed. (n.s.) P > 0.05, (**) P ≤ 0.01, (****) P ≤ 0.0001. n = 41 for all untreated cells (−Dox). n = 41 for A with Dox; n = 38 Tel with Dox; n = 41 Late Tel with Dox. (A) Anaphase, (T) telophase, (Late T) late telophase. Data shown as mean ± SD. Scale bars, 5 µm

