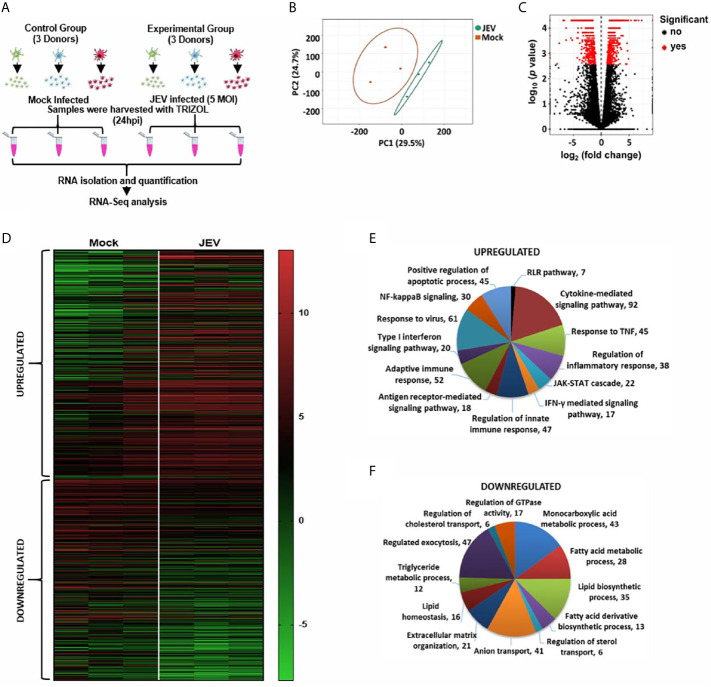
Figure 2.
RNA-seq analysis of JEV infected moDCs. (A) Schematic representing the work plan for RNA-seq analysis. moDCs from three healthy donors were mock/JEV infected (5 MOI, 24 h), and RNA-seq analysis was performed. (B) The normalized raw intensities of all samples was used to generate the Principal-component analysis (PCA) plot using ClustVis server. (C) Volcano plot showing genes detected by RNAseq. Differentially expressed genes (DEGs) are marked as red dots and were identified on the basis of log2 fold-change ≥2 (FDR-adjusted p < 0.05) (D) Heatmap showing hierarchical clustering of DEGs between mock and JEV-infected condition in the three donors. (E, F) Gene Ontology (GO) enrichment analysis of upregulated and downregulated genes in JEV vs mock condition was performed using Metascape to study biological processes.

