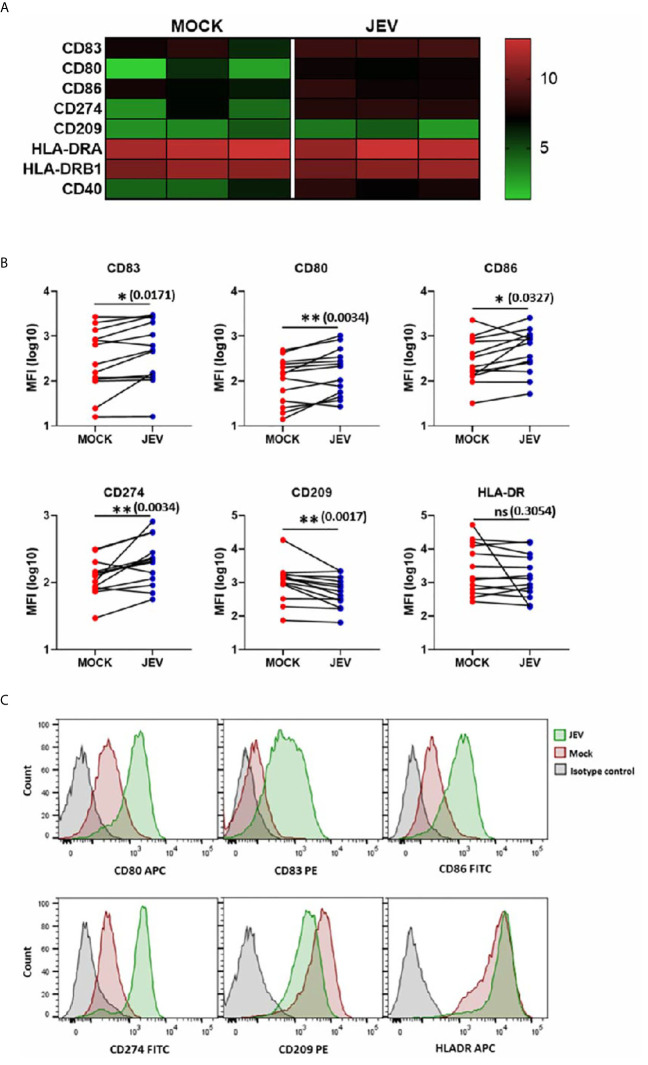
Figure 3.
Upregulation of maturation markers in JEV infected moDCs. (A) Heatmap showing transcriptional upregulation of DC maturation and other co-stimulatory markers in mock vs JEV-infected condition in the three donors. (B, C) The cell surface expression of DC maturation and co-stimulatory markers was quantified by flow cytometry in mock/(5 MOI) JEV-infected moDCs at 24 hpi. Data for each donor is shown as median fluorescence intensity (MFI) with the mean (n = 13 donors). *p < 0.05; **p < 0.01 (Wilcoxon matched-pairs signed-rank test). (C) Representative flow cytometry profile of one donor. Ns, not significant.

