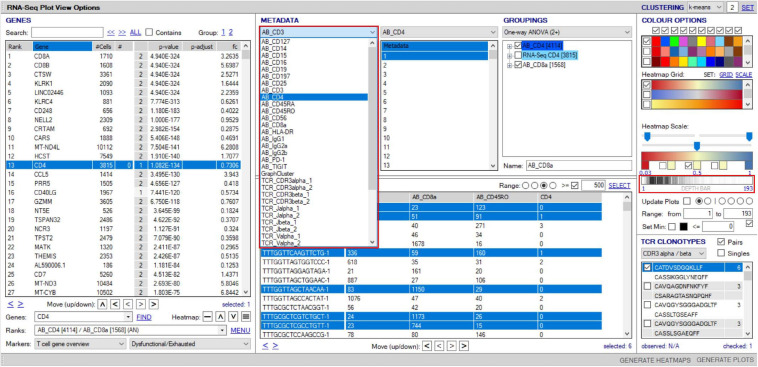
FIGURE 11.
Overlay of surface protein expression (scCITE-seq) onto scTCR–RNA-seq analyses. Within the “RNA-seq plot viewer options” window, normalized CITE-seq data are included in the “Metadata” panel, accessible via the dropdown tab (highlighted red). All applications discussed for scRNA-seq analyses are applicable to protein with differential analyses between groups, selection into groupings or dissection via the “cell/sample metadata/domain. Depth bar (highlighted red) provides detail of protein expression density via a white-to-black scaling with darker areas representing most abundant expression.

