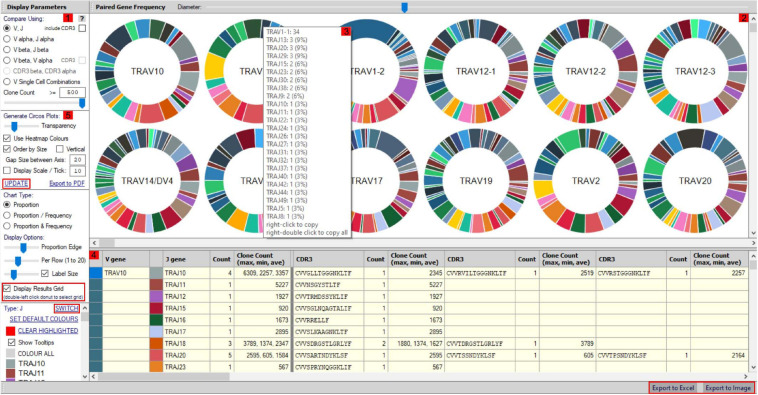
FIGURE 2.
scTCR-seq paired gene/CDR3 frequency window. The scTCR-seq analysis home screen window is divided into key domains to help direct analyses by the user. (1) Gene pairings or corresponding CDR3 sequences can be selected for analysis by the user within the “display parameters” domain. (2) Representative pie charts display proportion (and frequency) of TCR genes/CDR3 within the selected sample for initial indication of data. Each pie depicts one TCR chain with the colored border representing proportional number of pairings with corresponding chains as selected in domain 1. The central chain can be switched using “Switch” (highlighted red) in the parameters panel for alternate pairing view. (3) Hovering over select pies provides an information box with proportional representation (%) of total pairings within. (4) Paired genes are displayed in grid format by selecting “display results grid” (highlighted red), which can be exported direct to Excel or Image (highlighted red). (5) Circos plots can be generated for selected samples/pairings by clicking “Update” (highlighted red).

