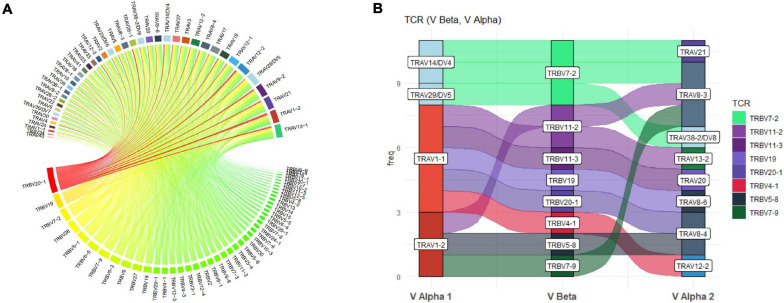
FIGURE 3.
Circos and Sankey plots to display holistic clonality, dominance, and complex pairings. (A) Circos plots provide an overview of TCR pairing clonality and dominance within a selected sample as shown for TRAV and TRBV pairings and can also be produced for paired CDR3. Alpha genes are listed at the top and paired to respective β genes at the bottom with width and color (red to green) of each segment proportionate to comparative dominance of total functional TCR pairings. (B) Sankey plot illustrating more complex gene interactions identified by sequencing, shown for TRAV-TRBV-TRAV triad, detailing clone frequency on y-axis.

