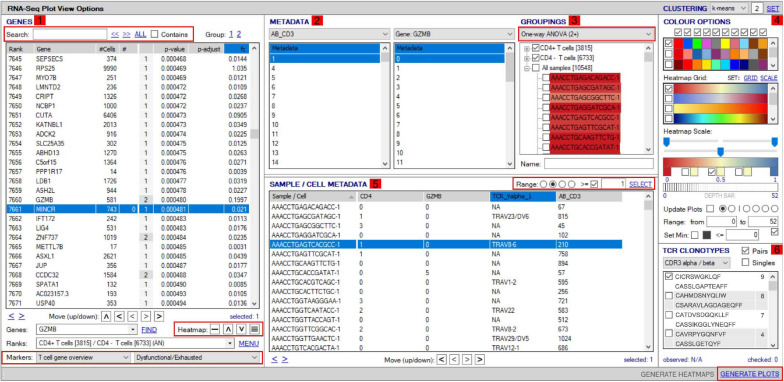
FIGURE 4.
Workflow for analyses of scTCR–RNA-seq data using VGAS plot viewer window. The scTCR–RNA-seq analysis home screen window is divided into key domains to help direct analyses by the user. (1) “Genes” panel lists all genes expressed with options to search for specific genes of interest (highlighted red), reorder, and find literature determined groups of interest genes using the “Markers” dropdown tab or heatmap (highlighted red) individual genes on the UMAP for selected sample. (2) “Metadata” is displayed with dropdown tabs to select data by sample, clinical metadata, or phenotype groupings defined by indexed flow data or via unsupervised K means clustering on whole sample with consensus calling from reference atlas databases. (3) Grouped data/clusters appear in the “Groupings” domain for selection and differential analyses using a range of statistical algorithms contained in the dropdown tab (highlighted red). Differential gene analysis results provide p-value, p-adjusted, and fold change displayed in “Genes” panel. (4) Groups and plots can be fully color-customized in the “Color options” panel and heatmap scales set to user preference. (5) Genes of interest, metadata, or groupings can be saved and set as metadata for further interrogation or grouping by several parameters in the “Sample/cell metadata panel.” User-defined positive cutoff range for numerical data can be applied to filter samples using “Range” function toggle (highlighted red). (6) scTCR-seq defined clonotypes can be set from whole data or distinct RNA-defined groups in the “TCR clonotypes” domain. Circos plots can also be generated from within this panel. The “generate plots” function, bottom right (highlighted red), provides access to associated UMAP.

