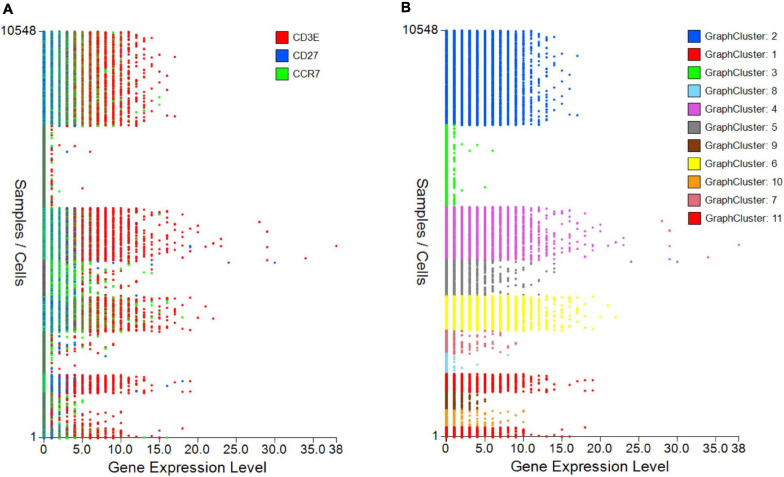
FIGURE 5.
Gene expression plots to provide cutoffs for negative/positive expression or show differences between samples/groups. (A) Single or grouped gene expression plots for all cells within a selected sample provides a platform to set cutoff for positivity and identify outlier expression or (B) highlight expression differences between samples/plates.

