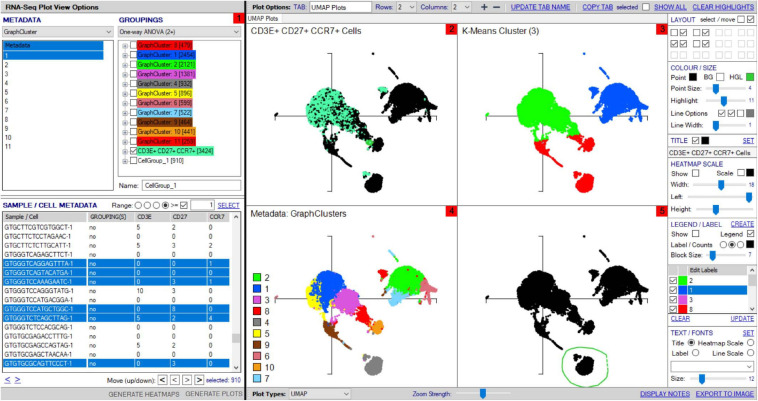
FIGURE 6.
Multipanel UMAP investigation. (1) Sample/cell groupings created in “Groupings” panel can be plotted on multipanel UMAPs, with zoomed view possible to focus on different regions of interest (2–5). (2) Groupings created from differentially expressed genes and metadata can be highlighted within the total cell population, shown for CD3E+CD27+CCR7+ cells group defined in panel 1. (3) K-means clustering can be set in the scRNA-seq Plot View Options window and illustrated within UMAP. (4) Cell types from unsupervised clustering can be separately colored on a UMAP with legend for visualization. (5) Cell clusters can be “lassoed” on the UMAP and highlighted within the “Sample/cell metadata” grid for addition to distinct groups within “Groupings” for further analyses, named “CellGroup_1” in groupings tab.

