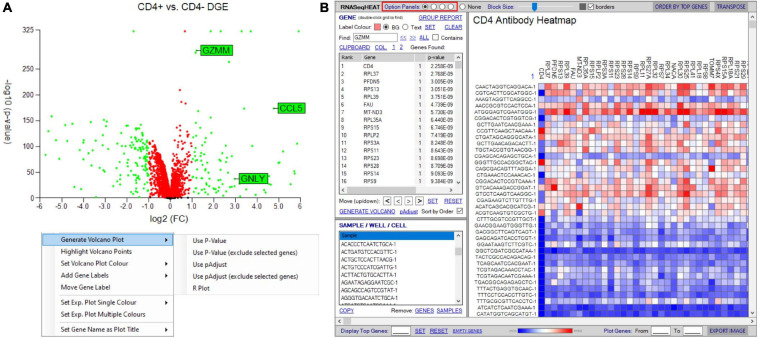
FIGURE 8.
Tools to visualize differential gene expression. (A) Volcano plot for differential expression analysis between two groupings/samples. User-defined thresholds can be set for fold change and significance, visualized according to color (red and green represent genes above different preselected fold change (FC) and significance (p-value). Right-click menu provides options for addition and formatting of gene labels, plot coloring, and exclusion of selected genes. (B) RNASeqHEAT enables generation of a heatmap of selected genes as shown on horizontal axis and with selected samples on vertical axis. Option panel (highlighted in red) allows customization.

