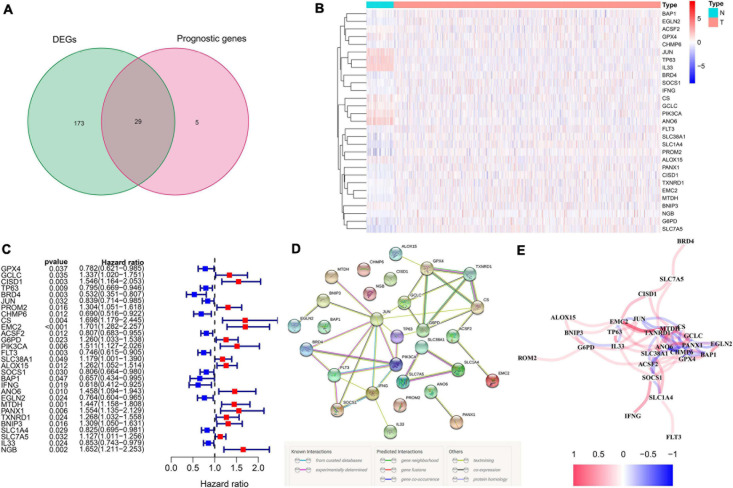
FIGURE 2.
The identification of the candidate ferroptosis-related genes in the TCGA cohort. (A) Differentially expressed genes between breast cancer and adjacent normal breast tissue that were correlated with OS are shown by a Venn diagram. (B) The heatmap of the 29 overlapping genes’ expression in breast cancer tissues. (C) The univariate Cox regression analysis between gene expression and OS are shown by the forest plots. (D) The interactions among candidate genes are shown by the PPI network through the STRING database. (E) The correlation network of selected candidate genes (different colors represented different degrees of correlation coefficient).

