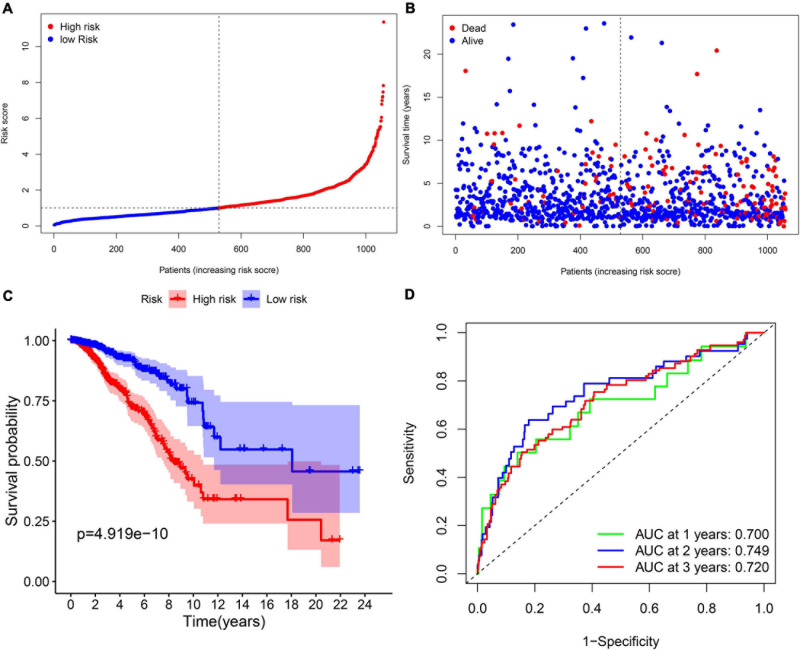
FIGURE 3.
The prognostic analysis of the 11-gene signature model in the TCGA cohort. (A) The distribution and median value of the risk scores in the TCGA cohort. (B) The distribution of OS, OS status, and risk score in the TCGA cohort. (C) The Kaplan–Meier curves for the OS of patients in the TCGA cohort which was divided into high-risk group and low-risk group. (D) The AUC of time-dependent ROC curves was used to verify the prognostic performance of the risk score in the TCGA cohort.

