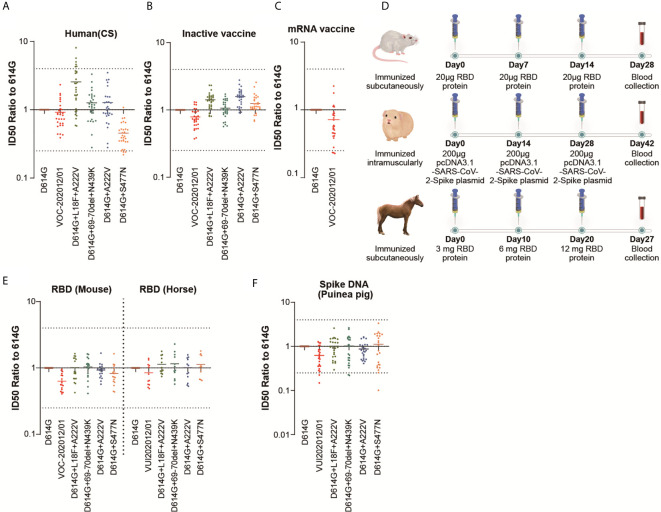
Figure 3.
The neutralization activity of polyclonal Abs against the five epidemic variants. Sera were serially diluted and the other procedures were the same as described for Figure 2A . Scatter plot of (A–F) showing the neutralization ID50 ratio of each variant to that of D614G. Each point represents a single result, and the dashed line represents the mean value. The results are a summary of at least three repeated experiments. The dotted line represents 4-fold changes. (D) showed the animal immunization scheme.

