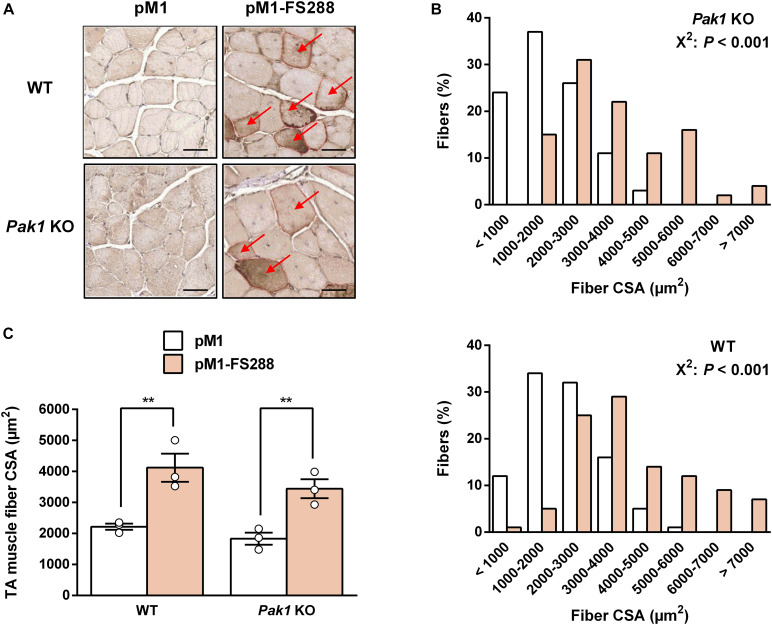
FIGURE 3.
Follistatin induces skeletal muscle hypertrophy despite the absence of Pak1. (A) Representative FS-c-myc immunochemistry image from TA muscle of Pak1 KO and WT littermate mice. Red arrows indicate C-myc positive fibers. Scale bar = 50 μm. (B) Muscle fiber size distribution from pM1-FS288-transfected vs. pM1-transfected TA muscles of Pak1 KO (up panel) and WT (bottom panel) mice (n = 3/group). (C) Muscle fiber CSA assessed 17 days after electroporation of pM1-hFS288 (orange columns) or pM1 (white columns) in TA muscles from Pak1 KO vs. WT littermate mice (n = 3/group). Results are expressed as mean ± SEM. Statistical analysis was performed using two-way ANOVA test and Bonferroni post-tests (FS effect: **P < 0.01). Fiber CSA distribution statistical analysis was performed using χ2 Pearson test (P < 0.001).

