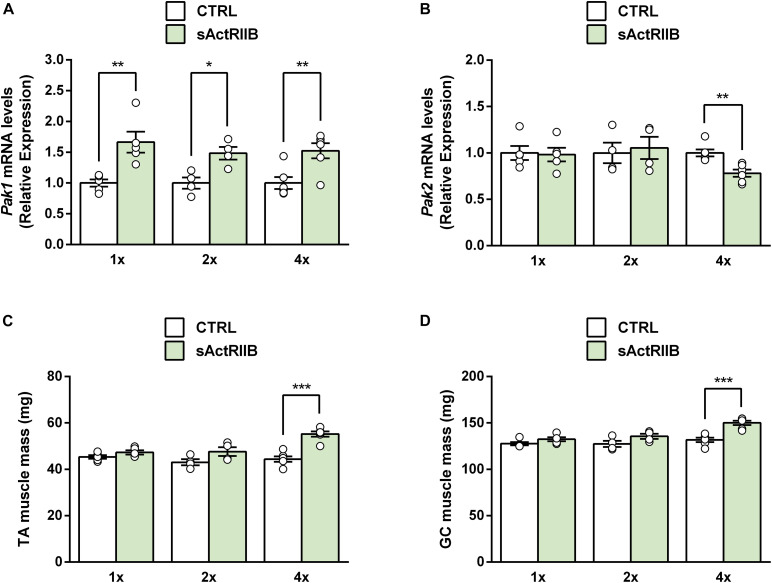
FIGURE 4.
Muscle Pak1 and Pak2 mRNA levels in response to skeletal muscle hypertrophy induced by MSTN inhibition. (A) TA muscle Pak1 and (B) Pak2 mRNA levels, (C) TA and (D) GC muscle weight after one, 2 or 4 injections of sActRIIB (green columns) or PBS (white columns) in WT mice (n = 4–6/group). Results are expressed as means ± SEM. Statistical analysis was performed using unpaired t-test to compare results from sActRIIB-treated and PBS-treated mice (*P < 0.05; **P < 0.01, and ***P < 0.001 vs. CTRL).

