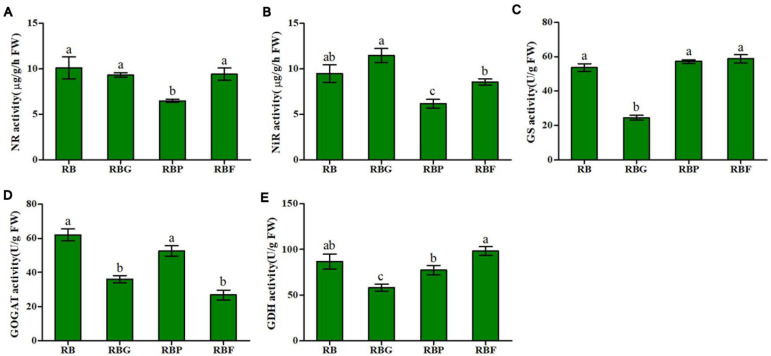
FIGURE 4.
Effects of spectra on enzyme activity of nitrogen metabolism in lettuce. (A) NR activity, (B) NiR activity, (C) GS activity, (D) GOGAT activity, (E) GDH activity. RB, 75% red + 25% blue LED; RBG, 60% red + 20% blue + 20% green LED; RBP, 60% red + 20% blue + 20% purple LED; RBF, 60% red + 20% blue + 20% infrared LED. The letters represent the significant difference of different treatments (p < 0.05).

