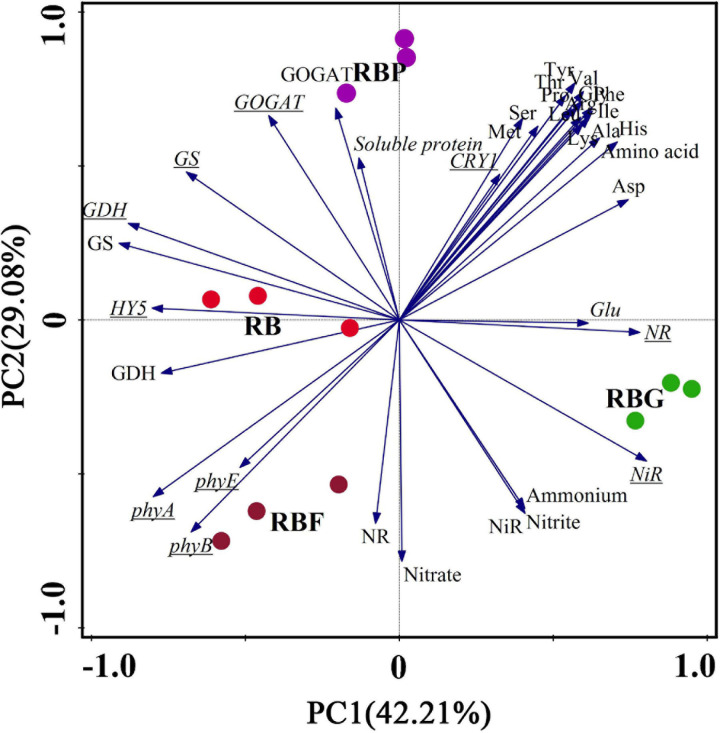
FIGURE 7.
Principal component analysis (PCA) showing differences and correlations in nitrogen assimilation in lettuce leaves under different illumination spectrum. Scatter plot with different color indicated four light treatments (n = 3 replications). Underlined letters indicate genes expression. RB, 75% red + 25% blue LED; RBG, 60% red + 20% blue + 20% green LED; RBP, 60% red + 20% blue + 20% purple LED; RBF, 60% red + 20% blue + 20% infrared LED.

