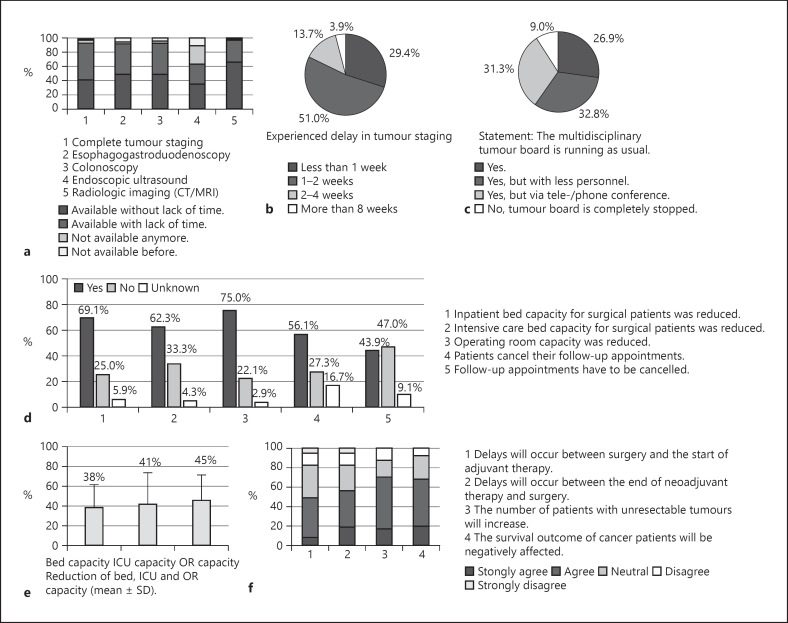
Fig. 2.
Graphical depiction of the results of question section No. 4 (tumour diagnostics, a–c) and No. 5 (oncological treatment, d–f) of the survey. a Impact on various tumour diagnosis units. b Presentation of the extent of the perceived delay in diagnosis. c Report on the continuation of the tumour board. d Effects on capacities of surgical departments and oncological follow-ups. e Mean reduction (±SD) of operating room, bed, and ICU bed capacity. f Expected effects on treatment plans and cancer outcome. SD, standard deviation.

