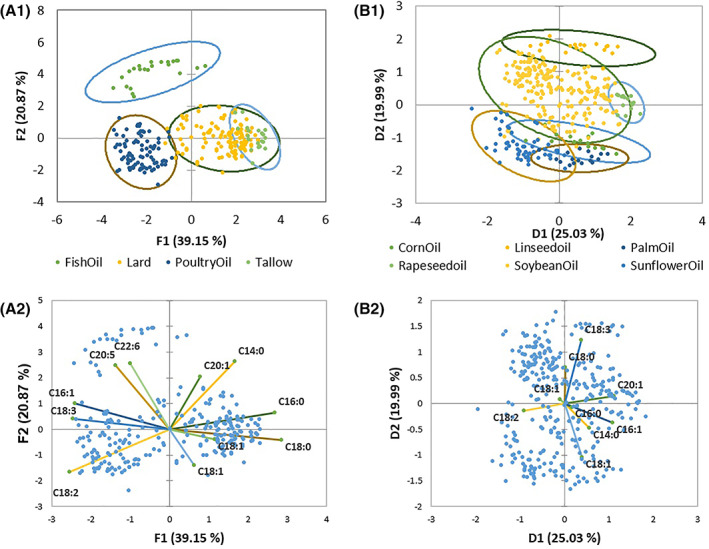
Figure 1.

Principal component analysis of 11 predominant fatty acids for animal fats (observation plot pane A1, biplot pane A2) and nine predominant fatty acids for plant oils (observation plot pane B1, biplot pane B2). Ellipses indicate the 95% confidence interval.
