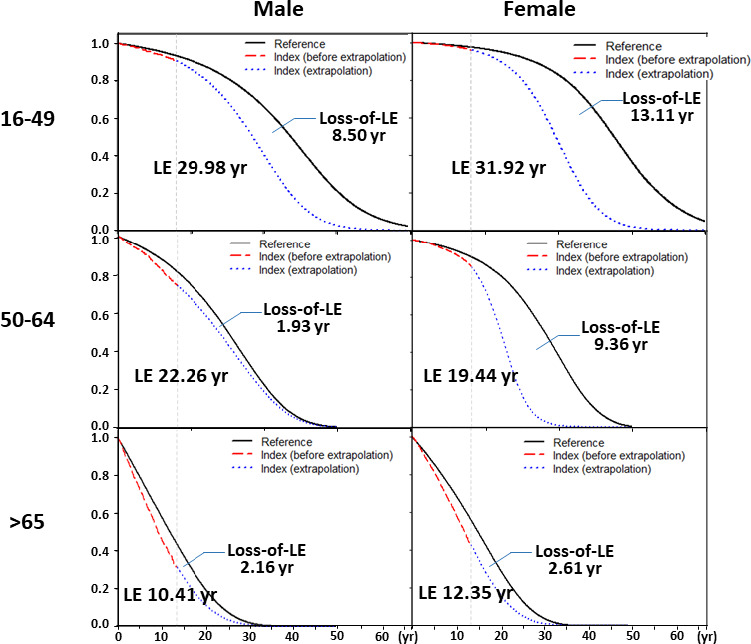
Figure 1.

Life expectancy (LE) and loss of life expectancy after diagnosis of rheumatoid arthritis (RA), stratified by sex and age (in years) at diagnosis. Black lines represent sex‐ and age‐matched referents simulated from Taiwanese national life tables; red lines represent data from the RA cohort; blue lines represent extrapolation from the RA cohort. The area between the curve for matched referents and that for the RA cohort is the loss of life expectancy.
