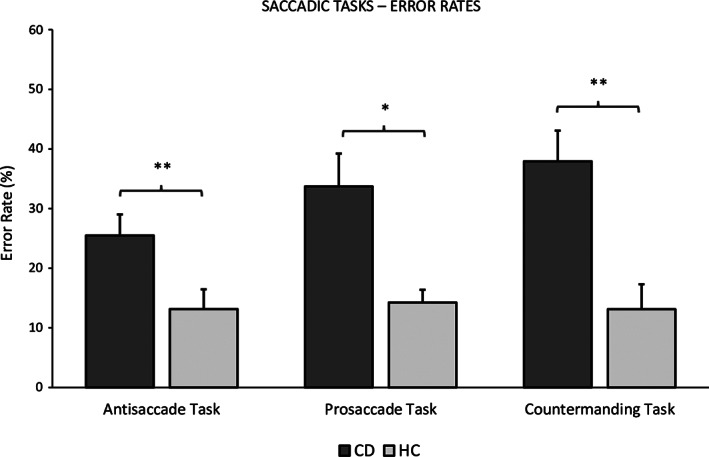
FIG. 1.

Results and comparison between groups of the saccadic tasks' error rates. Each column represents the mean error rate, each presented with standard error of the mean on top. The directional error is depicted for the antisaccade task, the anticipatory error for the prosaccade task, and the failed inhibition error for the countermanding task. Asterisks represent the difference between groups (*P < 0.05; **P < 0.01). CD, cervical dystonia; HC, healthy controls.
