
Figure 4.
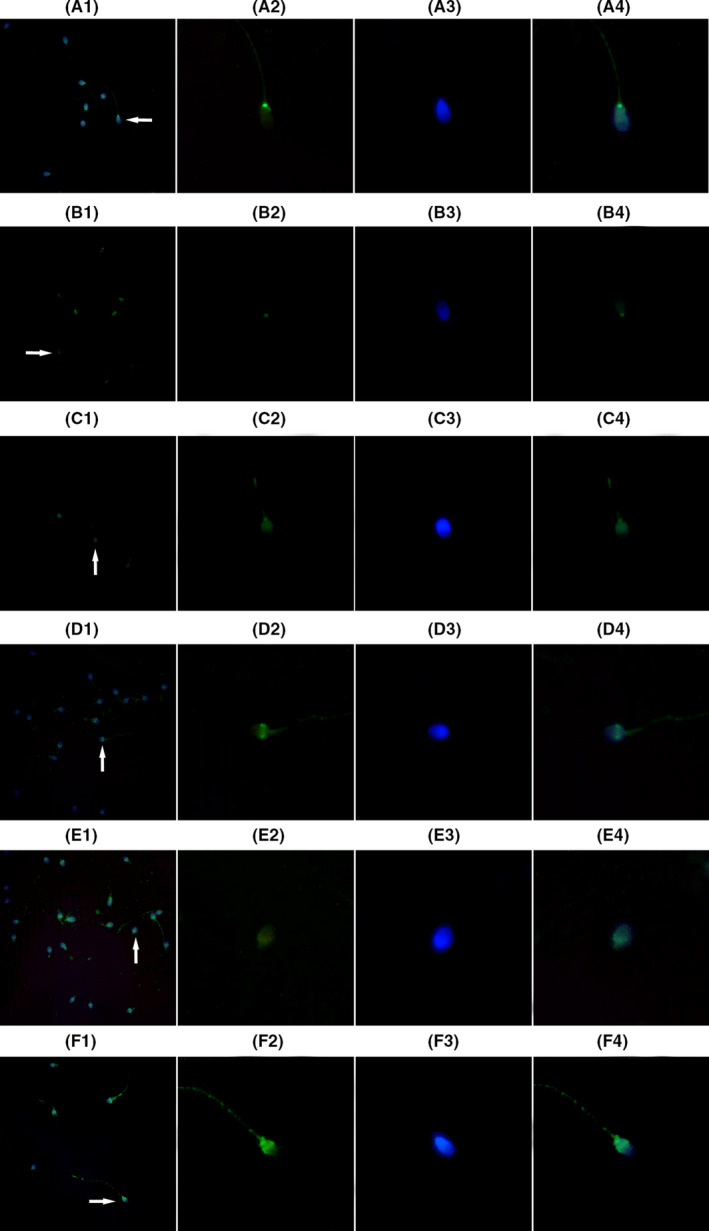
The effects of HBs exposure on expression of Bcl2, Bax, and Apaf‐1 proteins in the sperm cells. A1‐4, C1‐4, and E1‐4 showed expression of Bcl2, Bax, and Apaf‐1 proteins in the sperm cells not exposed to HBs, respectively (the control group); B1‐4, D1‐4, and F1‐4 showed expression of Bcl2, Bax, and Apaf‐1 proteins in the sperm cells exposed to HBs at concentration of 25 μg/mL, respectively (the test group). 1. Low‐magnification micrographs of seminal smears. 2. A signal of the fluorescence‐labeled protein (green) in a single sperm cell. 3. DAPI‐stained nucleus (blue) in a single sperm cell. 4. A merged figure of 2 and 3. The fluorescence intensity in the test group B was weaker than that in the control group A, indicating that HBs decreased Bcl2 expression. The fluorescence intensity in the test groups D and F was stronger than those in the control groups C and E, indicating that HBs increased Bax and Apaf‐1 expression.