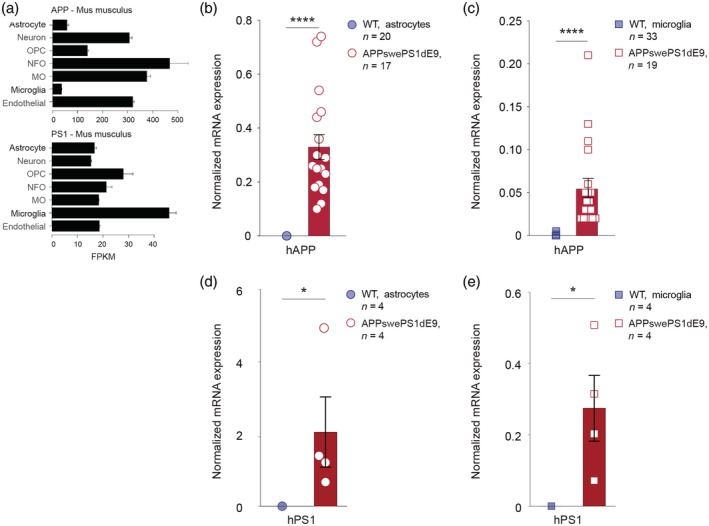
FIGURE 2.

Endogenous and transgenic APP and PS1 expression in astrocytes and microglia. (a). Expression levels of endogenous APP and PS1, modified from https://web.stanford.edu/group/barres_lab/brain_rnaseq.html. Cells were isolated from the cortices of P7 mice (Zhang et al., 2014). (b,c) Cortical astrocytes and microglia were isolated from 15‐ to 18‐month‐old WT (blue) and APPswePS1dE9 mice (red) by FACS procedures, described in detail by Orre et al. (2014). RNA was isolated using TRIsure and cDNA was generated following the manufacturer's instructions (Quantitect – Qiagen). Resulting cDNA served as a template in real‐time qPCR assays (SYBR Green PCR Master Mix; Applied Biosystems), as described by Kamphuis et al. (2015). To determine expression levels of the humanized APP (hAPP) transgene the following primers were used: FW: TGAACCATTTCAACCGAGCTG and REV: GTGGGTACCTCCAGAGCC. Transcript levels were normalized to HPRT and GAPDH levels. (b) Normalized mRNA expression of hAPP is higher in astrocytes of APPswePS1dE9 mice (n = 17 mice) compared to WT (n = 20 mice, the level of hAPP was below the limit of detection in 17 samples). (c) Normalized mRNA expression of hAPP is higher in microglia of APPswePS1dE9 mice (n = 19 mice) compared to WT (n = 33 mice, the level of hAPP was below the limit of detection in 29 samples). (d,e) Cortical astrocytes and microglia were isolated from 4‐month‐old wild‐type (blue) and APPswePS1dE9 mice (red) by MACS procedures, adapted from protocol by Orre, Kamphuis, Osborn, Melief, et al. (2014). To determine expression levels of the hPS1 transgene the following primers were used: FW: GAGGACAACCACCTGAGCAA and REV: ATCTTGCTCCACCACCTGC. Transcript levels were normalized to HPRT and GAPDH levels. (d) Normalized mRNA expression of hPS1 is higher in astrocytes of APPswePS1dE9 mice (n = 4 mice) compared to WT (n = 4 mice, the level of hPS1 was below the limit of detection in three samples). (e) Normalized mRNA expression of hPS1 is higher in microglia of APPswePS1dE9 mice (n = 4 mice) compared to WT (n = 4 mice, the level of hPS1 was below the limit of detection in three samples). FACS, fluorescence‐activated cell sorting; FPKM, fragments per kilobase million; GAPDH, glyceraldehyde‐3‐phosphate dehydrogenase; hAPP, humanized amyloid precursor protein; HPRT, hypoxanthine phosphoribosyltransferase; hPS1, human presenilin 1; MACS, magnetic‐activated cell sorting; MO, myelinating oligodendrocyte; NFO, newly formed oligodendrocyte; OPC, oligodendrocyte progenitor cell; PS1, presenilin 1; WT, wild‐type. *p < .05, ****p < .0001, Mann–Whitney test
