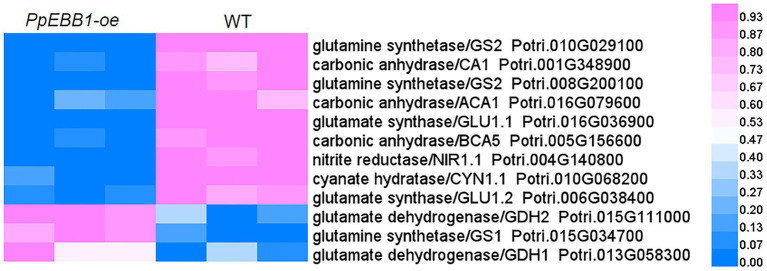
Figure 4.
PpEBB1 greatly influenced nitrogen metabolism. DEPs involved in nitrogen metabolism between PpEBB1-oe and WT. Proteins with significant (p < 0.05) > 1.3 or <1/1.3-fold changes between PpEBB1-oe line 29 and WT were identified as DEPs. Purple represents higher expression, while blue represents lower expression. The expression value of DEPs in proteomics data were processed by Min-MaxNormalization from 0 to 1, and the scale is represented in the expression level.

