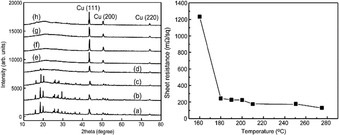
Figure 10.

Left: XRD patterns of films annealed at different temperatures. (a) as printed, (b) 100 °C, (c) 120 °C, (d) 140 °C, (e) 160 °C, (f) 180 °C, (g) 200 °C, (h) 275 °C. All unlabelled peaks are from the unconverted Cuf precursor. Right: variation of Rs as a function of the annealing temperature. Reproduced with permission from ref. [73], Copyright 2012, Royal Society of Chemistry.
