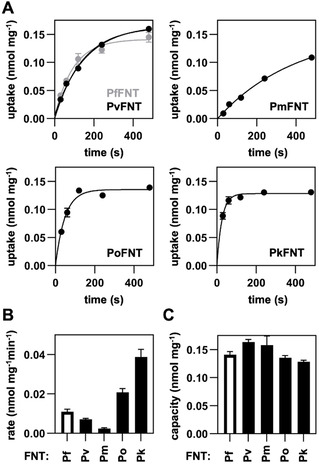
Figure 2.

Functionality of yeast‐expressed human‐pathogenic plasmodial FNTs. A) Uptake of 14C‐labeled l‐lactate (1 mM inward gradient at pH 6.8) into FNT‐expressing yeast cells over time. B) Transport rates as determined from exponential fittings from the uptake curves (dependent on the FNT expression level). C) Transport capacity calculated from the plateaus of the transport curves (independent from the FNT expression level). Error bars denote S.E.M. (n=3).
