Fig 2.

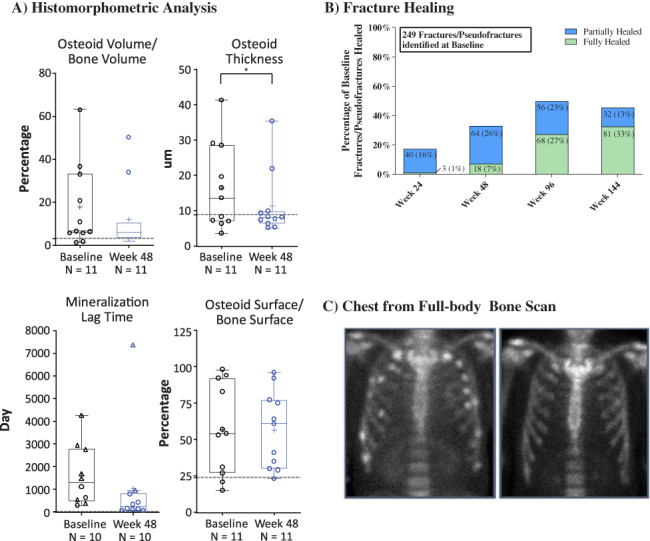
Histomorphometric and fracture assessments. Histomorphometric data (A) are presented as median, interquartile, 1.5× interquartile range, mean (+), and individual data points (○); for mineralization lag time, individual data points that were calculated using imputation are shown (∆); (13) *p < .05. Gray line indicates upper limit of normal reference ranges for osteoid volume/bone volume 3.05%, osteoid thickness 8.9 μm, mineralization lag time 28.6 days, and osteoid surface/bone surface 23.9%, and are from Glorieux and colleagues.( 11 ) Fracture healing data (B) are presented as number and percentage of baseline fractures and pseudofractures. A total of 20 (8.03%) and 48 (19.3%) fractures and pseudofractures that were identified at baseline were considered not readable or were not evaluated at weeks 96 and 144, respectively. Zoomed‐in image of chest from a full‐body bone scan (C) demonstrates multiple fractures/pseudofractures at baseline with reduction in fractures/pseudofractures at week 144.
